Weak Dollar
Portfolio manager’s Letter May 2007
Major Currency Index – Weak Dollar
The weak dollar, as measured by the FED’s Major Currency Index closed yesterday at 78.99 this is the lowest close in the history of the index, which dates back to 1972. There had been support on the charts around 80 that had lasted for 20 years. In 1991 the index bottomed at 82.52, in 1995 at 79.21 which was the all time low until yesterday. The most recent test of this level was in 2005 when the weak dollar index bottomed at 79.27.
With the DOW breaking 13,000 no one is paying attention to what is happening to the weak dollar, but history may prove that the trend of the greenback will have a greater long term impact on stock values. The question is, how long before the rest of the world decides they don’t need our paper anymore? On April 29, the Wall Street Journal ran a story that pointed out there is a dark side to the weak dollar decline.
“Wall Streeters have been cheering on a global economy that’s booming even as the US economy flags … Robust growth outside of the US means robust demand for goods globally. That helps the overseas sales of multinationals but could also push up prices at home for globally traded goods. While the US economy lumbered in the first quarter, China’s GDP was 11.1% above its year-ago level, which means that China’s appetite for raw materials has only grown”.
“With the rest of the world growing faster relative to the US, the rest of the world has become a more attractive place to invest – one reason for the weak dollar. On a trade-weighted basis, the weak dollar has hit its lowest level against the currencies of major US trading partners in the 36 years the Federal Reserve has been keeping records”.
That means that the weak dollar buying power has been reduced compared with other currencies. Profits earned abroad translate into more weak dollars at home, but it also means it costs more to import products.
Since the end of 2005 the weak dollar is down about 11% against the Major Currency Index. How attractive is the 4.6% yield on a weak dollar denominated bond when the currency is depreciating at 11% per year? If the foreign central banks decide to sell our debt, how do we keep the price of the bonds from going down and hence interest rates from going up?
“Overall import inflation has moderated because oil prices aren’t rising as fast as they did a couple of years ago. But other signs of import inflation are out there. In March, prices for imported consumer goods, excluding automobiles, were 1.8% higher than they were a year earlier – the biggest gain in 11 years, points out Morgan Stanley economist Richard Berner. The risk is that this could make it harder for the FED to cut rates in the presence of economic weakness. Calling it stagflation – the coupling of economic weakness and skyrocketing prices – is partly the result of the weak dollar overdoing it, but there’s a whiff of it in the air.”
It is hard for me to understand the strength of the market in the face of the weak dollar making new lows. Throughout the nineteen nineties, the dollar moved higher, and the market followed. We now have the weak dollar moving to new lows, but the market is going up. Perhaps most troubling is the possibility that the FED might be reluctant to expand money supply aggressively during a recession if this import inflation is pushing higher.
For the last 90 years (Since inception), the Federal Reserve Board has held power to control domestic interest rates. Yet we may awake one day soon to a world where it is a different central bank that is driving the bus because of the weak dollar.
Berkshire Hathaway Look-Through Earnings
I have included my list of Berkshire Hathaway look through earnings for 2006.
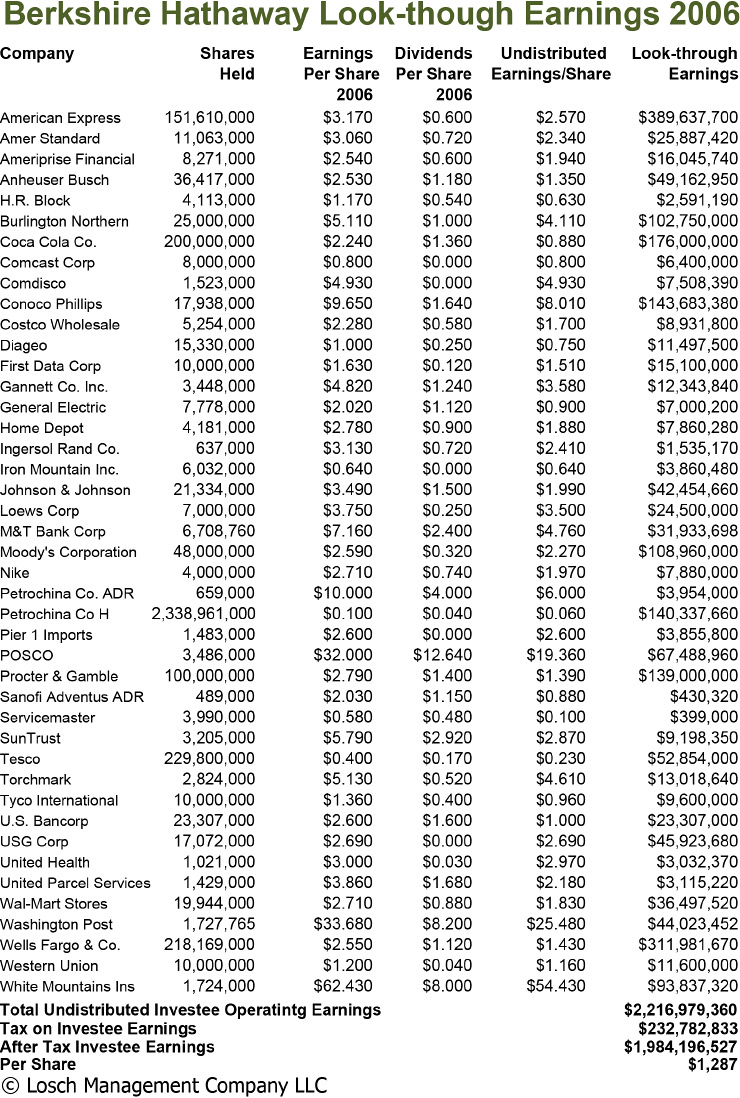
A couple of notes:
- I included Burlington Northern as a $1.9 Billion position as a proxy for the mystery positions Warren Buffett told us about in the annual report.
- It is difficult to find per share earnings and dividends for foreign stocks, and when listed, the amounts are usually given in foreign currencies, so the figures for POSCO, Tesco, and Diageo are estimates.
My list gives a figure of $1.88 billion or $1,222 per A share for 2006 Investee earnings. If we add this to the reported figure of $7,144 per share it gives us a figure of $8,366 per share, and an almost insanely cheap PE ratio of 13.1. It is interesting to compare this figure to some Warren Buffett’s recent purchases.
Burlington Northern has a PE of 18 and revenue growth of 10.2% per year for the last five years, while Berkshire Hathaway’s Revenue has increased by 20.6% per year over the same period. I if I had to pick between the two stocks I would pick Berkshire.
Wells Fargo has a PE of 14.2 and revenue growth of 11.5% with potential sub prime mortgage problems. Again, if I had to pick the better value it would be Berkshire Hathaway. US Bancorp has a PE of 13.3, but revenue growth of only 2.3% per year. Tesco has a PE of 20 and Revenue growth of 12.5%. Johnson and Johnson has a PE of 18.7 and revenue growth of 10.5%. Indeed the only purchases that would appear statically cheaper than BRK are POSCO and Conoco Phillips.
It is not my intent to criticize any of these purchases; on the contrary they would all seem to be large, high quality companies whose prices are reasonable, if not as cheap as Warren Buffett previously required. I do not think that there is any question that this area of the market (Large Cap Growth) is a lot cheaper today than it was four years ago. In a new world with a weak dollar, mediocre domestic growth; and a strong international economy, this group should easily out-perform the average domestic portfolio.
The fact remains that compared to the companies Warren Buffett is buying, Berkshire Hathaway (at least in my simple mind) is a better value. Berkshire Hathaway has a lower PE and faster revenue growth than most of the companies Warren Buffett is buying. Normally this would make you look for Warren Buffett to “buy-back” stock, but last year at the annual meeting Warren Buffett said that he will not do a “buy-back” because all that happens is the announcement drives the price of the stock up and he never gets to buy any stock at his price.
I think there is also another reason, later at the same meeting Buffett said that the day he passes will be a “bad day for him but it will not be a bad day for shareholders”. I think this is a promise that he means to keep, so he will be happy to see the price of the stock remain conservatively valued. Buy-backs, dividends; and stock splits will not happen because they will be left as weapons for his successor to use to keep Warren Buffett’s promise.
For the last five years Berkshire Hathaway’s price has lagged behind the rate at which its earnings have grown. The stock price has appreciated at an annual rate of 7.5%, but normalized growth of reported earning has been north of 20%, which means that in terms of value the stock is a lot cheaper today than it was five years ago. The good news is that it has become so cheap that in the future, it is likely that the stock price will have at least to keep pace with the company’s earnings growth and the help of the weak dollar.
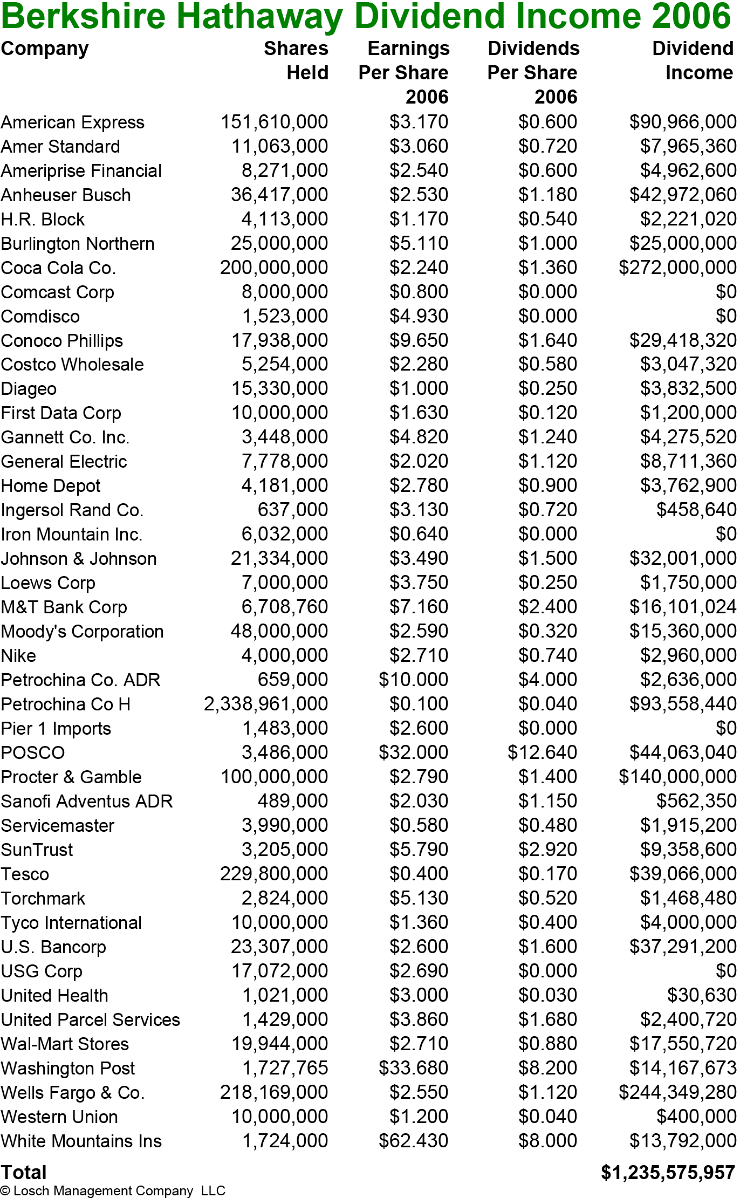
Berkshire Hathaway’s Dividend Income
I am also enclosing an itemized list of Berkshire Hathaway’s dividend payments received in 2006. The list indicates 2006 dividend income of $1.235 billion. This is a return of 2.0% on today’s market value, and a 5.5% return on Berkshire’s cost. 2.0% is a hell of a lot better that the 0.75% he was getting a couple of years ago on Berkshire Hathaway’s huge cash position.
In 2005 dividend income was $877 million which was a return of 1.9% on the then market value, and 5.5% on Berkshire Hathaway’s cost.
In 2003 dividend income was $480 million which was 1.4% on Market and 5.6% on Berkshire’s cost. As you can see, in three years dividend income has nearly tripled. Warren Buffett is clearly buying stocks that pay a significant dividend. This would indicate that Warren Buffett is willing to pass up the current higher return from T bills; it may indicate he expects lower short term rates, and that he prefers the lower tax rate on dividends (Berkshire Hathaway’s tax rate on dividends is about 10% whereas interest income is taxed at 35%).