Economic Cycles
Portfolio manager’s First Quarter 2017 Letter
Economic Cycles
Successful investing is about the long term, in the market, patience trumps genius. The best investors understand the cyclical nature of our economy, using these economic cycles rather than getting used by them. The market will go up the market will go down, for the average investor it is best not to pay too much attention, just make sure that you are invested in companies that will be able to survive, and perhaps even take advantage of, major market corrections. Add to your positions when prices are down and reduce your exposure when exuberance reigns supreme.
While it is uncertain when the next of the economic cycles will generate a bear market, what is certain is that it will happen. As speculation in the equity market increases in the late stages of a bull market, it is essential to gradually raise cash to be able to take advantage of the buying opportunities that will eventually appear.
To understand economic cycles, it is essential to know what is going on in the minds of the bankers, business managers, and investors. Markets reflect the mindset of all the participants, the collective intelligence and emotions of many millions of participants.
The reason that we have economic cycles is that these participants are human beings, and this foundation in human psychology means that some markets are more dangerous than others. You have smart markets and you have dumb markets.
An intelligent market is what happens after the bubble pops. The illusion of endless asset growth disappears, and we find out quite conclusively who has been swimming naked. The errors of the past become apparent, businesses fail, and fools are replaced. Investors’ bias switches focus from potential profit to loss aversion, and the upward economic cycles end.
Depending on the magnitude of foolishness, and the pain of the pop, the education provided can last a long time. After painful economic cycles, bankers will get a lot smarter or be replaced. It will often take a new generation before the old lessons are lost, and speculative excesses reemerge. Sooner or later, all economic cycles will end.
As Hyman Minsky, a liberal Economist from Washington University, pointed out, “stability unstable“, this was his way of describing why economic cycles reverse as there a tendency for loan quality to deteriorate. If a banker sees a competitor across the street, making more loans and increasing his revenue by lowering borrowing standards, pressure builds to follow suit to retain market share, if not profits. These economic cycles continue until loan quality has fallen to the point that defaults generate an economic decline.
Often it can take a long time for this economic cycle to play out and the markets to get dumb again. In the 1930’s it took until the 1960s, from the seventies it took until 2000. The smart people that survived the last crash have to be replaced before for the lessons learned in the previous bear economic cycles can be forgotten.
Economic cycles are a behavioral phenomenon, so they are not going to go away as long as there are humans in charge. Government intervention is at best like aspirin: it can give some relief for the symptoms, but it cannot cure the disease.
It is currently the opinion of many that the high valuation of the S&P 500 is evidence that the market has returned to its stupid state that precedes a market decline. If this is the case, it would be very premature from a historical perspective since the twin economic cycles crash the “aughts” should have provided an educational experience of a generational nature and have wiped a lot of foolishness for a good while. It is our view that the current long slog upward will continue for a good long while.
With interest rates near zero, equity values are not so much the product of irrational exuberance as they are the product of rational decisions by large institutional managers seeking better long term yields than those currently offered by the bond market. After all, a PE ratio of 20 still represents an earnings yield of 5%.
For an institution that needs yield to meet its obligations, 5% beats 1% to 2%. Other than these apparent equity values, there is little evidence of irrational exuberance in other parts of the economy.
So, what’s next? Equity valuations have reached high levels, and for there to be further substantial upside for the stock market in the next five years, there will have to be a strong earnings growth. The economic downturn in the 1970s provided a learning experience that propelled double-digit growth in corporate earnings in the eighties and nineties. If the “aughts” are to drive the economic cycles in the future the way the seventies did, then we are going to have to see substantial and steady growth in international trade.
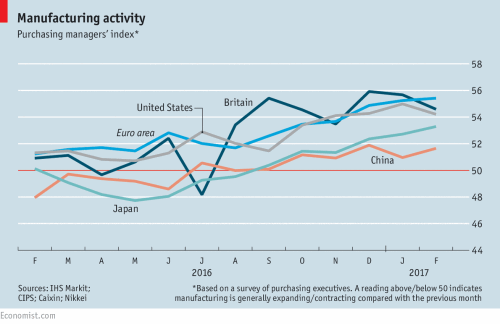
To those who see this prospect as a substantial stretch given the current political climate, I offer the following chart, which shows a marked increase in international economic activity since the middle of last year and two thoughts.
First, this trend from the middle of last year will have to continue. Second, no one in the early eighties would have predicted the kind of growth that we experienced in the subsequent two decades. The propellant then was the lessons we learned in the seventies and what it taught us: controlling costs through outsourcing and computerization. While it may seem unlikely that we can re-experience this kind of productivity growth, the cost of communication and computation will decrease substantially going forward.
While it is currently not possible to predict a repeat of the eighties and nineties, the great recession may have provided a learning experience that could provide future growth that is impossible to predict today. The situation needs to be carefully monitored, going forward. The key metrics to watch are the growth of corporate earnings and international trade. Investors should learn to recognize these economic cycles and use the knowledge to improve long-term returns.
Recency Bias
Kahneman and Tversky have identified recency bias as one of the heuristics that human beings used to simplify the thinking process. We tend to make judgments based on things that happened recently because they are easier to remember. The advantage of heuristics is that they easy and quick. The problem with heuristics is that they are often wrong and almost always wrong when it comes to dealing with complex problems.
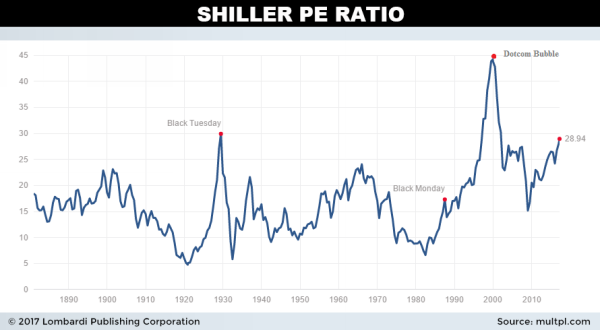
With two 50% equity market corrections, not too far back in the rear-view mirror, recency bias helps us to find the potential for sharp near term correction in the stock market. Current high stock values tend to re-enforce this bias, and indicators such as Shiller’s CAPE (Cyclically Adjusted PE) Ratio exaggerate the overvaluation. Shiller’s index is based on average inflation-adjusted earnings from the previous ten years, so it has some recency bias built-in. Currently, that PE ratio stands at 28.93 (see chart), which makes the market look expensive.
While it is a good idea to smooth year-to-year fluctuations in earrings to lessen the impact of economic cycles, the last ten years are an atypical period on which to base current valuations. Why? Consider earnings.
The first thing we notice from the Table below is that earnings for the last ten years are way below the long-term average. A comparison of the 20-year average to the 60-year average raises the possibility that even the 20-year figure is also below the long-term mean.
Corporate Earnings over Many Economic Cycles
|
Corporate earnings Growth for 60 years From Federal Reserve Board |
|
|---|---|
|
Period |
Average Annual Gain |
|
10 Years |
2.14% |
|
20 Years |
6.09% |
|
40 Years |
6.54% |
|
60 Years |
6.86% |
The next ten years may be as bad as the last ten years, but it is perhaps more likely that there be a reversion and that earnings for the next ten years would be a good deal more substantial than the last ten years.
The Shiller Index ignores the fact that earnings trends have a strong upward trend over the long term regardless of economic cycles. With steadily rising earnings (after-tax corp. earnings average annual gain for the last 60 years = 6.86% per year), the average of ten years does not accurately represent value in the 10th year.
For example, if a group of stocks starts year one with earnings of $1000 and their earnings grow at 6.86% per year, by year ten, those earnings will equal $1947, while the 10-year average will be a bit less than $1500. As a result, the $1500 figure is not an accurate representation of value in year ten and that therefore CAPE has a built-in bias to underestimate the present value.
The Effect of Tax CUT on Berkshire
Trump’s tax cut will improve reported earnings on the income statement, but will not necessarily improve the Company’s cash flow. The income statement for 2015 shows a theoretical tax expense of $10.532 billion which would amount to a tax bill of a little over 30% of pretax earnings of $34.946 billion.
But the actual amount of tax paid in 2015 as shown on page 57 of the annual report was $4.535 billion. This would indicate that Berkshire’s actual tax burden last year was 13%. I am not sure where all these breaks come from, but it is likely that much the difference is created by tax breaks such accelerated depreciation, and the tax credits the company earns for wind farm construction.
It would seem that if the corporate tax rate is lowered to 15% many of the existing breaks that Berkshire uses would be eliminated. So, while reported after tax earnings would increase, Berkshire’s actual cash flow may not, at least to the same extent as the increase in earnings
The devil here is in the details, the extent to which BRK benefits from a decrease in Corporate Income tax will depend on how the law is structured, which loop holes are eliminated. On the other hand, if credits for wind power remain or some of the accelerated depreciation is retained Berkshire could end up with an effective tax rate below its present 13%.
A tax reduction of the corporate rate to 15% would have increased reported earnings in 2015 by about $6 billion but it would not have brought in that amount of additional cash to Omaha, or anything near that amount. There is superficial benefit from being able to show higher reported earnings and a lower PE ratio, but it is cash that buys new assets.