• Home
  • About
  • Team
  • Contacts
  • Blog

Berkshire Hathaway Second Quarter 2010

  1. Home
  2. Blog
  3. Berkshire Hathaway S ...

Portfolio manager’s Letter August 2010

Berkshire Hathaway Second Quarter 2010 earnings

Operating results for the Berkshire Hathaway Second Quarter 2010 and first six months of 2010 were released on Friday August 6th. Berkshire Hathaway Second Quarter 2010 Net Earnings were $1.968 billion down from $3.295 billion for the same period last year. For six months, earnings were $5.601 billion up from $1.761 billion for the first half of 2009.

In contrast, Berkshire Hathaway Second Quarter 2010 Operating Earnings were up 73% to $3.074 billion, and up 52% for the first half to $5.296 billion. Buffett prefers the use of operating earnings as a measure of Berkshire Hathaway performance because the operating earnings are not distorted by the mark to market calculations for the long term put contracts, and other derivatives that Buffett sold several years ago.

This bit of GAAP gymnastics causes quarterly swings in net earnings of several billion dollars, and has made the quarterly GAAP figure (net earnings) that Berkshire Hathaway has reported for the last couple of years misleading to the point of being almost meaningless.

Berkshire Hathaway’s put options have being discussed here on several occasions and it is still our opinion that they will provide a very nice profit by the time they expire. The $2.2 billion loss that Berkshire Hathaway was required to report for the Berkshire Hathaway Second Quarter 2010 follows a similar sized gain that was reported in the first quarter of this year and also in the second quarter of 2009.

This is unfortunate, and it makes mark to market accounting look pretty silly in its application to these circumstances. It means that, in the case of Berkshire Hathaway second quarter 2010 we have what can only be considered a robust quarter (operating earnings up 73%) while the reported earning show decrease of 40%.

Berkshire Hathaway Two Column Valuations

In an attempt to get a better idea of what is actually going on at Berkshire Hathaway, I decided to update my version of the Berkshire Hathaway Twenty-Three Year Two Column Valuation table.

Berkshire Hathaway Second Quarter 2010 - Two Column Valuations

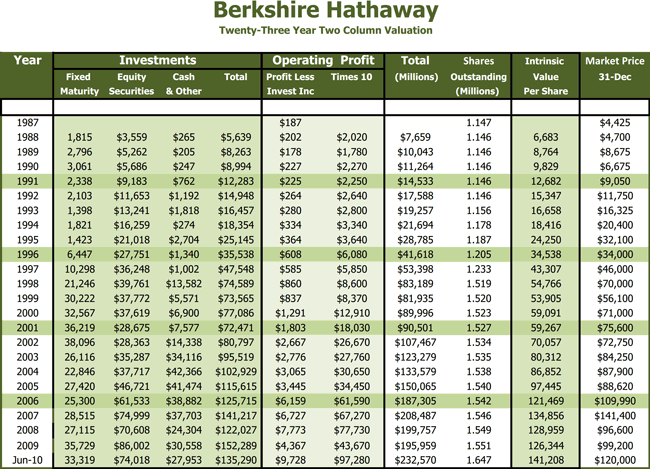
This is a method of valuation that Buffett has used to find an intrinsic value for Berkshire Hathaway second quarter 2010. While this method is helpful, it is not perfect, as it tends to understate Berkshire Hathaway’s value during periods of market weakness (2008 – 2010). Now, the market has rallied off 2009 lows, and Operating earnings have become a larger factor in valuation with the Burlington Northern merger so I thought it would be interesting to take a look at an update of this table.

Figures for 2010 are estimated based on including Burlington’s figures for the full year and estimating the other operating companies based on their results for the first half. Operating earnings listed on this table are pre-tax and taken from page 58 in the Berkshire Hathaway Annual Report.

Berkshire Hathaway Operating Earnings and intrinsic Value

The second table (below) included in this letter is a 20-year comparison of Berkshire Hathaway second quarter 2010 year-end price to its intrinsic value and operating earnings. It shows clearly that Berkshire Hathaway second quarter 2010 price is cheap relative to its recent history.

Berkshire Hathaway Operating Earnings Intrinsic Value

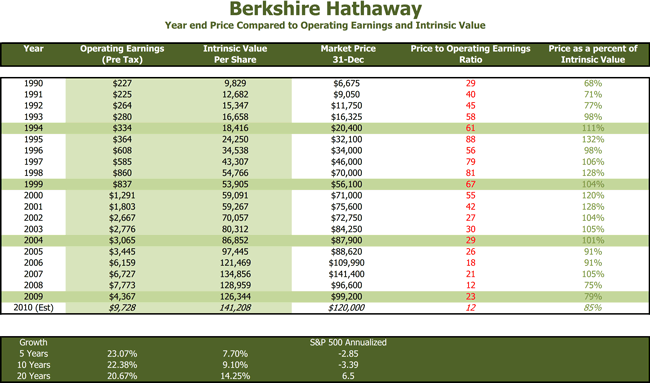
Note that intrinsic value shown here is taken from the two column table, and that this method of calculating IV is strongly influenced by the current stock market prices. This explains to some extent why the growth of intrinsic value as estimated with this method lags the growth in operating earnings. This is also a reflection of the fact that Berkshire Hathaway second quarter 2010 stock portfolio is not growing as fast as the operating part of the company as Buffett now prefers the complete acquisitions of companies as opposed to stock positions.

I included figures for the performance of the S&P 500 Average because this gives us a comparison to the overall stock market and indicates that even though Berkshire Hathaway second Quarter 2010 performance lags its long term record, it is still quite strong relative to its’ environment, and allows us to hope the company’s long term performance will improve when the market environment gets better.

08/01/2010


Leave a Reply Cancel Reply

Your email address will not be published.


Comment


Name

Email

Url


Blog Archive

2020

  • The Stock Market

2019

  • Behavioral Investing

2018

  • Trumped
  • Warren Buffett vs Wall Street
  • Globalism, 1982-2000 Bull Market

2017

  • Volatility Underlying Calm Market
  • What’s new with CB&I?
  • Passive Investing
  • Economic Cycles
  • Current Stock Market 2017 Comment

2016

  • Global Plastics Summit Highlights
  • Value Investing vs Index Investing
  • How to Play an Index Bubble
  • Successful Investors
  • Is the Market Overvalued?
  • Operating Earnings
  • Article by investment manager in Bay Hill Living
  • Building Foundation

2015

  • 3G Culture – Dream Big
  • Myopic Loss Aversion
  • CBI Nuclear Energy
  • St Joe Company
  • What’s in a Word? Plastics.
  • Are Bonds Safer Than Stocks?

2014

  • Chicago Bridge and Iron
  • CAMEX 2014
  • Global Economy October 2014
  • Fluor Corporation
  • Interesting Quotes from Daily Journal Annual Meeting
  • The Daily Journal Annual Meeting
  • Albemarle Corporation
  • Triumph Group
  • The American Energy Revolution
  • Singapore

2013

  • St Joe Company Update
  • Hedge Fund Managers
  • Triumph Group Inc.
  • Bitter Brew
  • An Antifragile Portfolio

2012

  • Leucadia National Corporation
  • This Time it is Different
  • Successful traders psychology
  • St Joe Company
  • Learning from Pain

2011

  • Long Cycles – Part II
  • Long Cycle
  • Nasty Month for Market
  • Make a Buck with Fortescue Metals Group
  • Berkshire Hathaway Look Through Earnings
  • St Joe Company Inc
  • Successful Investment Management
  • A Look Into Latin American Market
  • The Mother of all Quarters
  • 2010 Investment year results

2010

  • Fault Lines
  • US Market 2010
  • Berkshire Hathaway Third Quarter 2010
  • The Stock Market 2010
  • Berkshire Hathaway Second Quarter 2010
  • Berkshire Hathaway Performance
  • Long Term Greedy
  • Goldman Sachs
  • Berkadia and Leucadia
  • USG corporation
  • Berkshire Hathaway 2009 2010
  • Why Capitalism Works

2009

  • The Lords of Finance
  • The $44 Billion Dollar Train Set
  • Berkshire Hathaway 3rd Quarter 2009
  • Career Risk for Investment Manager
  • Berkshire Hathaway financial statements
  • Berkshire Hathaway Preferred Stock
  • Moral Hazard
  • Credit Default Swap
  • The Shadow Banking System
  • Learning Things the Hard Way
  • Our C-System
  • 2008 Investment results

2008

  • Investment Risk
  • Bear Markets
  • Generational Events
  • Orange sheets – Money is doing better
  • Inflation Not The Problem
  • Tipping Point
  • Long Term Capital Management
  • Financial Insurance
  • Western Refining Inc
  • Berkshire Hathaway Year To Date
  • Berkshire Hathaway Cash Flow
  • 2007 investment results

2007

  • Investment results 4th Quarter 2007
  • Greenspan on Inflation
  • Berkshire Hathaway Third Quarter 2007
  • Berkshire Hathaway Operating income 2007
  • Berkshire Hathaway Hedge Fund
  • Leveraged Buyouts
  • Stability Unstable
  • Weak Dollar
  • Berkshire Hathaway Chairman’s Letter
  • Steel Dynamics
  • Breakwater Resources
  • 2006 Investment year results

2006

  • New Investment Stocks
  • Equitas
  • Berkshire Hathaway Third Quarter 2006
  • Hurricane Synergy
  • Berkshire Hathaway Second Quarter 2006
  • Fat Pitch
  • Perfectly Obvious
  • Berkshire Hathaway Growth Rate
  • Berkshire Hathaway First Quarter 2006
  • Berkshire Hathaway Annual Report 2006
  • Inflation Is
  • 2005 Investment year results

2005

  • Exogenous Events
  • The Easy Money
  • Look-Through Earnings
  • High-Risk Mortgages
  • Unintended Consequences
  • Rydex Ursa Fund
  • Warren Buffett Premium
  • Private Equity
  • Latticework Mental Models
  • Buffett’s Lackluster Performance
  • 2004 Investment year results
  • Professor Smith’s Second Bubble

2004

  • Hedging Currency Disaster
  • Risk Assessment
  • Too Many Bears
  • The Chinese Century?
  • Patterned Irrationality
  • Timber
  • Costco’s Cash
  • Physics Envy by Charlie Munger
  • Asset Allocation Berkshire Hathaway
  • The Balance of Payments
  • 2003 Investment year results

2003

  • Hedge Funds
  • The trade deficit is not debt
  • Secular Bear Market
  • Which Index Funds?
  • A Different Drummer
  • Costco’s Float
  • The Power of Float
  • Berkshire Hathaway Annual Meeting 2003
  • Psychology of Human Misjudgment
  • Sitting on the Sidelines
  • Berkshire Hathaway intrinsic value
  • 2002 Investment year results

2002

  • Insurance company Moats
  • Bond Bubble
  • Berkshire Hathaway Cash Flow 2002
  • Behavioral Economics
  • The Bear Market 2002
  • Greenspan Put
  • Second Quarter Cash Flow at Berkshire Hathaway
  • Berkshire Hathaway Annual Meeting 2002
  • Red Wire – Green Wire
  • Stupid FED Tricks
  • The Bottom Line
  • 2001 Investment year results

2001

  • Don’t Fight the FED
  • Buy and Hold? – It all Depends
  • Ben Laden and Berkshire Hathaway
  • The Dinosaurs Dance
  • Costco Moat
  • Bubble Watching
  • Sit on your Ass investing
  • Berkshire Hathaway Annual Meeting 2001
  • Carnival Cruise Lines
  • 450000 Square Ft Furniture Store
  • Lunch Money Indicators – Annual report
  • Other People’s Money

2000

  • Bear Tracks
  • Build It and Money Will Come
  • Efficient Stock Market
  • Style Drift
  • Lunch Money Indicators – Options
  • Identifying Problems
  • Small Retail Stocks
  • Charlie Munger comments
  • Big Al and the Bubble Machine
  • Berkshire Hathaway Cheap
  • Index Funds
  • 16 rules for investment success
Make an appointment or contact us by phone: +1 (689) 246 49 49
© 1999 - 2022 Losch Management Company
Support by Global AGM