• Home
  • About
  • Team
  • Contacts
  • Blog

Current Stock Market 2017 Comment

  1. Home
  2. Blog
  3. Current Stock Market ...

Stock market 2017 gets upset

The FED indicates it might raise interest rates three time and stock market 2017 gets upset. We have seen abnormally low rates for so long that investors seem to have lost perspective. Realistically, it is going to take a lot more than a three quarters of a percent increase from here to have any negative impact our economy. In 2008, the FED had to raise rates to 5.50% before the economy started to cool. In 2000, rates rose to 6.75% before the tech bubble popped. The 1990 recession was preceded by rates of over 10%, and the granddaddy of all bubble poppers was Volker’s 1981 peak of 22.5%.

Stock Market 2017, Federal funds rate

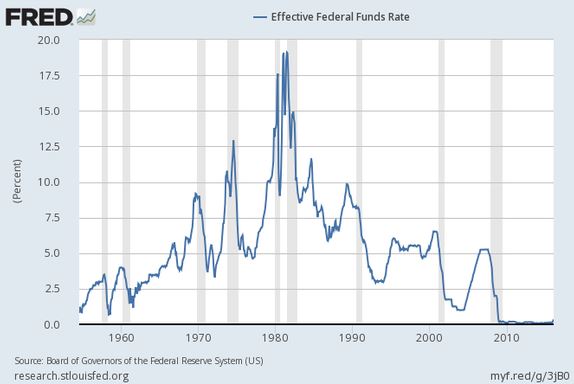
To get back to the 2008 peak at the current rate of increase stock market 2017 (three increases per year of one-quarter point each) it would take almost five years before seeing anything that approaches tight money. Yet, as always, there is much to worry about. With the post-election euphoria succumbing to political reality, Trump’s inauguration arrives with the question of how much of the new president’s pro-business agenda will actually get put in place.

So, the conversation is beginning to shift back to talk of apparent overvaluation in the stock market 2017. However, closer examination reveals that much of this overvaluation is concentrated in a small number of very large capitalization stocks. For this reason, it is a bit of oversimplification to attribute this overvaluation to the stock market 2017 as a whole. In fact, it is still possible to find reasonably priced companies once you leave the universe the S&P 500. Holding a lot of cash or going short is a bet the stock market 2017 will decline. Eventually the stock market 2017 will decline (it always has), but when, and from what point?

With interest rates still below 1% and with the world awash in cash, where does that cash go? Large institutions (Pension funds and insurance companies) have to earn money on their cash balances to pay their obligations, and as long as equities promise a better return than bonds that is where the money will flow.

Supply and Demand

The Willis Towers Watson surrey of Global Pension Assets lists global pension assets at the end of 2015 $21.7 trillion, compared to $21 billion for 1950. Sure that is only a difference of 3 zeros, but the devil is in where you put the zeros. The annual growth rate for pension fund assets during this 65 years period was 11.27%.

In the same time period, the S&P 500 has increased from 16.88 to 2034, for an annual growth rate of 7.65%. Since stock prices, like everything else, are ultimately determined by supply and demand. If we assume that global pension assets can be considered can be considered a rough measure of the demand for equities, it appears that, in the last 65 years, the demand for equities has increased substantially faster than the supply of equities. Because of this, it seems to me that the logic of using a measure of value such as the PE ratio as the only factor in estimating future stock prices is somewhat myopic.

I will leave to others to estimate a future range of PE ratios, but one thing that does appear obvious is that PE ratios will be higher when interest rates are low, and lower when interest rates are high. Further, I think it is logical to expect that future long term rates of return on equities may be somewhat lower than what we could expect from a study of past history.

A couple caveats: On one hand, pension funds may not be a perfect indicator of the growth in demand for equities. These are rough estimates, and the figure 1950 refers to US pensions, because I could not find a figure for the global measure on that date. On the other hand, these figures may underestimate total growth in the demand for equities because, in 1950, the percentage of total assets that pension funds invested in fixed income was much higher that it is today.

01/31/2017


Leave a Reply Cancel Reply

Your email address will not be published.


Comment


Name

Email

Url


Blog Archive

2020

  • The Stock Market

2019

  • Behavioral Investing

2018

  • Trumped
  • Warren Buffett vs Wall Street
  • Globalism, 1982-2000 Bull Market

2017

  • Volatility Underlying Calm Market
  • What’s new with CB&I?
  • Passive Investing
  • Economic Cycles
  • Current Stock Market 2017 Comment

2016

  • Global Plastics Summit Highlights
  • Value Investing vs Index Investing
  • How to Play an Index Bubble
  • Successful Investors
  • Is the Market Overvalued?
  • Operating Earnings
  • Article by investment manager in Bay Hill Living
  • Building Foundation

2015

  • 3G Culture – Dream Big
  • Myopic Loss Aversion
  • CBI Nuclear Energy
  • St Joe Company
  • What’s in a Word? Plastics.
  • Are Bonds Safer Than Stocks?

2014

  • Chicago Bridge and Iron
  • CAMEX 2014
  • Global Economy October 2014
  • Fluor Corporation
  • Interesting Quotes from Daily Journal Annual Meeting
  • The Daily Journal Annual Meeting
  • Albemarle Corporation
  • Triumph Group
  • The American Energy Revolution
  • Singapore

2013

  • St Joe Company Update
  • Hedge Fund Managers
  • Triumph Group Inc.
  • Bitter Brew
  • An Antifragile Portfolio

2012

  • Leucadia National Corporation
  • This Time it is Different
  • Successful traders psychology
  • St Joe Company
  • Learning from Pain

2011

  • Long Cycles – Part II
  • Long Cycle
  • Nasty Month for Market
  • Make a Buck with Fortescue Metals Group
  • Berkshire Hathaway Look Through Earnings
  • St Joe Company Inc
  • Successful Investment Management
  • A Look Into Latin American Market
  • The Mother of all Quarters
  • 2010 Investment year results

2010

  • Fault Lines
  • US Market 2010
  • Berkshire Hathaway Third Quarter 2010
  • The Stock Market 2010
  • Berkshire Hathaway Second Quarter 2010
  • Berkshire Hathaway Performance
  • Long Term Greedy
  • Goldman Sachs
  • Berkadia and Leucadia
  • USG corporation
  • Berkshire Hathaway 2009 2010
  • Why Capitalism Works

2009

  • The Lords of Finance
  • The $44 Billion Dollar Train Set
  • Berkshire Hathaway 3rd Quarter 2009
  • Career Risk for Investment Manager
  • Berkshire Hathaway financial statements
  • Berkshire Hathaway Preferred Stock
  • Moral Hazard
  • Credit Default Swap
  • The Shadow Banking System
  • Learning Things the Hard Way
  • Our C-System
  • 2008 Investment results

2008

  • Investment Risk
  • Bear Markets
  • Generational Events
  • Orange sheets – Money is doing better
  • Inflation Not The Problem
  • Tipping Point
  • Long Term Capital Management
  • Financial Insurance
  • Western Refining Inc
  • Berkshire Hathaway Year To Date
  • Berkshire Hathaway Cash Flow
  • 2007 investment results

2007

  • Investment results 4th Quarter 2007
  • Greenspan on Inflation
  • Berkshire Hathaway Third Quarter 2007
  • Berkshire Hathaway Operating income 2007
  • Berkshire Hathaway Hedge Fund
  • Leveraged Buyouts
  • Stability Unstable
  • Weak Dollar
  • Berkshire Hathaway Chairman’s Letter
  • Steel Dynamics
  • Breakwater Resources
  • 2006 Investment year results

2006

  • New Investment Stocks
  • Equitas
  • Berkshire Hathaway Third Quarter 2006
  • Hurricane Synergy
  • Berkshire Hathaway Second Quarter 2006
  • Fat Pitch
  • Perfectly Obvious
  • Berkshire Hathaway Growth Rate
  • Berkshire Hathaway First Quarter 2006
  • Berkshire Hathaway Annual Report 2006
  • Inflation Is
  • 2005 Investment year results

2005

  • Exogenous Events
  • The Easy Money
  • Look-Through Earnings
  • High-Risk Mortgages
  • Unintended Consequences
  • Rydex Ursa Fund
  • Warren Buffett Premium
  • Private Equity
  • Latticework Mental Models
  • Buffett’s Lackluster Performance
  • 2004 Investment year results
  • Professor Smith’s Second Bubble

2004

  • Hedging Currency Disaster
  • Risk Assessment
  • Too Many Bears
  • The Chinese Century?
  • Patterned Irrationality
  • Timber
  • Costco’s Cash
  • Physics Envy by Charlie Munger
  • Asset Allocation Berkshire Hathaway
  • The Balance of Payments
  • 2003 Investment year results

2003

  • Hedge Funds
  • The trade deficit is not debt
  • Secular Bear Market
  • Which Index Funds?
  • A Different Drummer
  • Costco’s Float
  • The Power of Float
  • Berkshire Hathaway Annual Meeting 2003
  • Psychology of Human Misjudgment
  • Sitting on the Sidelines
  • Berkshire Hathaway intrinsic value
  • 2002 Investment year results

2002

  • Insurance company Moats
  • Bond Bubble
  • Berkshire Hathaway Cash Flow 2002
  • Behavioral Economics
  • The Bear Market 2002
  • Greenspan Put
  • Second Quarter Cash Flow at Berkshire Hathaway
  • Berkshire Hathaway Annual Meeting 2002
  • Red Wire – Green Wire
  • Stupid FED Tricks
  • The Bottom Line
  • 2001 Investment year results

2001

  • Don’t Fight the FED
  • Buy and Hold? – It all Depends
  • Ben Laden and Berkshire Hathaway
  • The Dinosaurs Dance
  • Costco Moat
  • Bubble Watching
  • Sit on your Ass investing
  • Berkshire Hathaway Annual Meeting 2001
  • Carnival Cruise Lines
  • 450000 Square Ft Furniture Store
  • Lunch Money Indicators – Annual report
  • Other People’s Money

2000

  • Bear Tracks
  • Build It and Money Will Come
  • Efficient Stock Market
  • Style Drift
  • Lunch Money Indicators – Options
  • Identifying Problems
  • Small Retail Stocks
  • Charlie Munger comments
  • Big Al and the Bubble Machine
  • Berkshire Hathaway Cheap
  • Index Funds
  • 16 rules for investment success
Make an appointment or contact us by phone: +1 (689) 246 49 49
© 1999 - 2022 Losch Management Company
Support by Global AGM