Our C-System
Portfolio manager’s Letter February 2009

At a time when the financial media has become convinced that the sky is falling, it is perhaps a good time to stop and consider the impact of market psychology on our investment decisions and learn to check your C-system.
James Montier has written a book on Behavioral Finance, runs the short side of a hedge fund; and writes a news letter for Societe Generale. He is one of my favorite financial commentators. In a recent Letter he discussed behavioral patterns that lead the typical investor to emotional errors of judgment in bear markets.
Our problems stem from the fact that within the human brain, emotion tends to override the C-system. “Our brains consist of two different (although interconnected) systems. One is a fast and dirty decision-maker (the X-system). The other is more logical but slower (the C-system)”.
While this emotional override response served a useful purpose for our ancestors confronted with a wooly mammoth, it is not nearly as constructive for today’s investor faced with a market that is rapidly eating his net worth “Effectively from an evolutionary standpoint a rapid response to fear carried a meager cost to a false positive, relative to the potentially fatal cost of a false negative”. While the X-system was necessary for the survival of our ancestors, the C-system is much more useful when making investment decisions.
C-System and Bear Markets
So, fear of a negative outcome may have helped our ancestor’s survival; it is not nearly as useful when dealing with contemporary financial markets, where C-system is essential. As an example of this negative impact, Montier sites a 2005 study by Shiv, Loewenstein, Bechara, Damasio, and Damasio (2005) Investment Behavior and the negative side of emotion.
“They asked players to participate in the following game. At the start of the game you are given $20 and told the following the game will last 20 rounds. At the start of each round you will be asked if you would like to invest. If you say yes then the cost will be $1. A fair coin will then be flipped. If it comes up heads you will receive $2.50 back, if it comes up tails then you will lose your $1”.
It is optimal to invest in all rounds due to the more substantial return if you win (expected value is $1.25, giving a total anticipated value to the game of $25). There is only a 13% chance that you end up with overall earnings of less, so the C-system says play all the time.
The second thing we know about this game is that the outcome in a prior round shouldn’t impact your decision to invest in the next round, after all the coin has no memory.
There were three groups of participants in the experiment. The first came from a very unusual group, they have a very specific form of brain damage; effectively these individuals can no longer feel fear. The second group (normals) are people like you and I. The third group (control patients) are those with brain damage in other parts of the brain not related to the processing of emotion (and fear).
When the experiment tested these three groups on the percentage of time that they chose to invest after a round in which they had invested and lost. “The first group of players those who can’t feel fear behave pretty optimally, investing around 85% of the time after they have suffered a loss, but this is not because of their C-system; however, the other two groups display seriously sub-optimal behavior. So bad is the pain/fear of losing even $1 that these groups invested less than 40% of the time after a round in which they had suffered a loss!”
Even more impressive is the fact the study indicated a complete lack of leaning on the part of the normal group and the control group. Logic would say that participants’ performance would improve the longer the game went on, an effect that would be demonstrated by increasing rates of investments as the game when forward. Still, the opposite was true, and the longer the game went on, and the more negative outcomes experienced, the less that was invested by the last two groups, that were using their C-system.
From this Montier reaches the following conclusion. “The parallels with bear markets are (I hope) obvious. The evidence above suggests that it is outright fear that drives people to ignore bargains when they are available in the market, if they have previously suffered a loss. The longer they find themselves in this position the worse their decision-making appears to become. The fact that time seems to drain the ability to think rationally fits with a lot of the work done looking at the psychology of self-control.
Bear Market Fatigue and the C-system
“Baumeister (2003) 3 argues that self-control (effectively our ability to hold our emotions in check) is like a muscle – too much use leads to exhaustion. He concludes his survey of the field by highlighting the key findings of his research: When self-esteem is threatened, people become upset and lose their capacity to regulate themselves when self-regulation fails people cannot use their C-system and may become increasingly self-defeating in various ways”.
Unfortunately, many of the biases we face seem to stem from the X-system (the automatic part of our brain’s processing capabilities). As such, they are outside of our conscious awareness and, therefore, can sometimes (indeed one could say, often) go unchecked by the more logical C-system.
It is up to the individual investor to decide for himself the extent that his own X-system is in control, but as a hint for those of us that consider ourselves to be value investors we can look to our leader. We will not have the figures for the fourth quarter until the annual report is released but from the news we have of fourth quarter transactions, and if you subtract the $10 billion Buffett has said he will hold for catastrophe insurance it is likely the annual report will reveal that Buffett is pretty well fully invested for the first time since the early 1990’s.
So if we consider ourselves to be Value investors and are not fully invested you have to ask yourself if you really think you know something that Buffett does not, or if your X-system is in control and our reluctance place a good bet is primarily because of previous negative results.
Of course, none of this means that market will not go lower from here, but to get your C-system in control, it is time to focus only on the value of the individual stocks you own or would like to own. Ignoring the noise is easy to talk about, but hard to do, and the longer the bear market lasts, the louder the noise. This is the only way you have of overcoming the power of your emotions. My personnel therapy to block my pesky X-system, turn off CNBC, cut back on reading newspapers, and spend more time writing. For me, there is something about writing that elevates the C-system.
C-System Put Float
Morningstar in a recent story about Berkshire Hathaway’s put options, they ran the statistics for the last 58 years and discovered that:
“Since 1950, using daily data on the S&P 500 (adjusted to include dividends); there are roughly 11,850 days to compare where the index was relative to where it was 12 years earlier. The average 12-year return on the S&P 500 since 1962 was 165%. In other words, since 1962, the S&P 500 has on average more than doubled over any 12-year period.
The S&P 500 actually fell below where it was 12 years prior on 58 days over that time frame, or about one half of 1% of the time. The average 12-year change in the S&P 500 for those 58 days was negative 3.5%. In other words, the S&P 500 declined over a 12-year period only one half of 1% of the time, and when it did, the decline was less than 5%.”
In other words, if the last 58 years can be used as guide Berkshire Hathaway’s fair chance of taking any loss on the puts, they have sold is one in two hundred, not something to disturb his C-system. In terms of the risk, this deal is probably way safer than the typical reinsurance contract. But nice as this discussion sounds, it is still missing the real point. What these puts are about is float and not just any float but float with a beautiful long tail. The real point that we should focus on is what Buffett can do with the $4.5 billion in premium money that he got for selling the puts, and that he gets to keep for 15 to 20 years.
Examples of what Buffett and his C-system can do with the $4.5 billion;
1.One thing we know for sure is that he was getting 10% plus an equity kicker in October (Goldman Sachs, GE), and that today that yield has risen to 12% – 15% (Harley). $4.5 billion at 10% for 17 years equals $22 billion.
According to the press release that accompanied last year’s first quarter 10Q the Puts where written to cover a period of either 15 or 20 years, but since this statement also said that some of the puts expire in 2019 that means that some of them have been around for a while. Those that expire in 2019 must have been written in 2004. This makes it somewhat more difficult estimate Berkshire Hathaway’s return because we do not know how many of the puts where written in what year, and it is likely that the eventual return for the puts written 2004 will be lower than for those written more recently.
2. We do not know yet if Buffett has bought any junk bonds, but we do know that in 2002 Buffett bought $8 billion in high yield debt. So, with current junk bond current yields above 18%, it is certainly possible that his C-system has by now found a home for a few billion in this area.
3. In 1995 Berkshire Hathaway bought the 51% of GEICO they did not already own for 2.3 billion. The purchase would have placed a total value on GEICO of about $4.5 billion. In 1995 GEICO’s pretax earnings where $302 million by the end of 2007 (12 years later) their pretax income was about $1.7 billion for annual return of 15.75%. If the value of the company grew at the same rate for the 12 years it would have been worth $26 billion by the end of 2007.
That’s only 12 years the same rate of return if carried for 17 years leaves you with $54 billion plus all annual dividends that have been paid by GEICO to Omaha. So if Buffett gets the same return on the put float it would yield an eventual profit well in excess of $54 billion.
4. Maybe GEICO is not representative of future expected returns. So, let’s use our C-system to look at returns on the float that has been used to buy common stock.
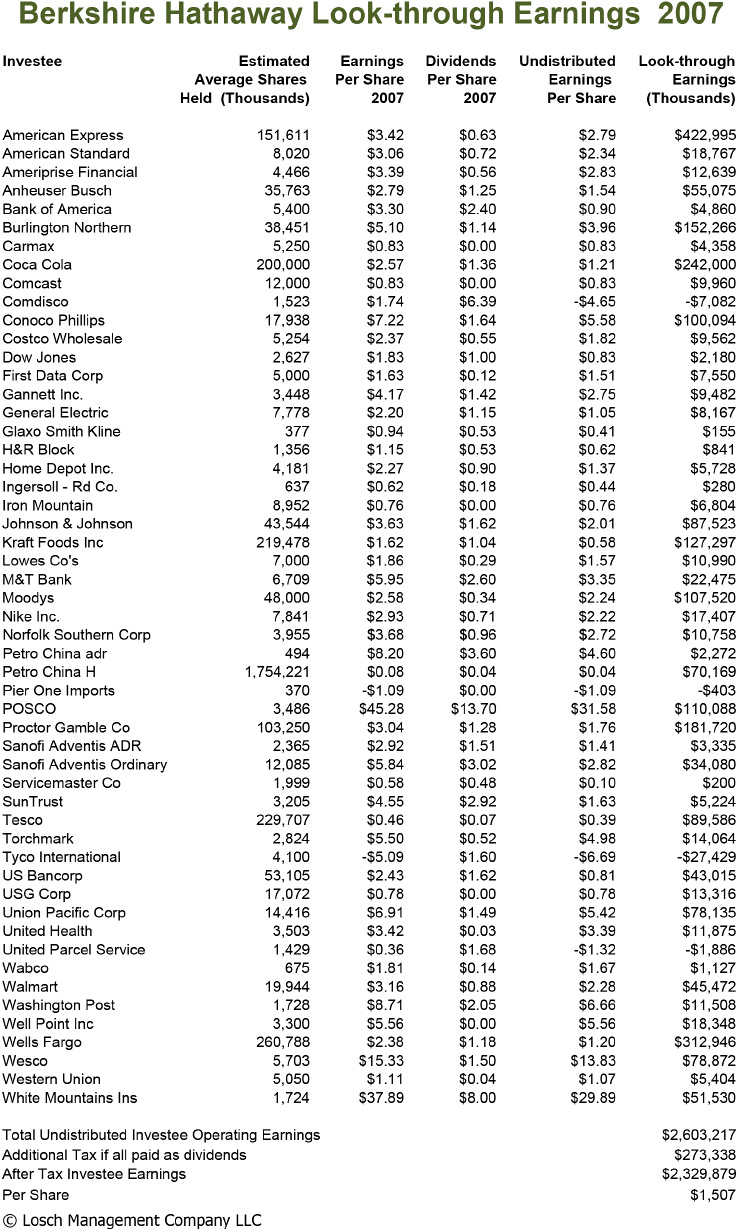
In 2007 Berkshire Hathaway’s “Undistributed Investee Operating Earnings” where $2.6 billion. See Berkshire Hathaway’s Look-through Earnings 2007 table.
In addition Berkshire Hathaway received directly $1.67 billion in dividend income. Keep in mind that dividend income is one Buffett’s favorite ways to receive income because Tax Law provides that 85% of all dividend income received by a corporation is exempt corporate income tax. This rule applies to both common and preferred stock, but does not apply to interest paid by debt obligations. (See attached table on dividend income.)
$2.6 billion Plus 1.7 billion = $4.3 billion. Investment gains on Berkshire Hathaway’s stock portfolio in 2007 was $5.4 billion, so the company’s total return on its stock portfolio in 2007 was $9.7 billion divided by the cost total basis for all open positions of $39.2 billion means that Buffett’s pretax return on stock investing in 2007 was 24.7%. The investment gains were high in 2007 because of the PetroChina sale; so a C-system would use the average of investment gains for the last five years to get a more reasonable figure. Total investment gains in the last five years were $17.5 billion, so the average annual gain for the last five years would be $3.5 billion. $3.5 billion-plus $4.3 billion, divided by $39.2 billion = 20%. $4.5 billion invested for 17 years at 20% equals 99.8 billion.
The bottom line is that these puts, which are currently raising hell with Berkshire Hathaway earnings statements, actually carry minimal risk. The statistics provided by Morningstar show one chance in two hundred that there will be any loss on the puts. So a C-system says the odds are in Berkshire’s favor.
Further if that one in two hundred chance actually happened, the actual loss would likely be less than $2 billion, whereas, against this risk Berkshire Hathaway is more or less certain to earn somewhere north of $22 billion and realistically quite bit more than that on the float. The accounting distortion is made worse but the fact that buy the end of 2008 Berkshire Hathaway will have written off something over $9 billion as a noncash charge against their earnings. When the market does recover Berkshire Hathaway will then add this $9 billion back into earnings.
This example may well exaggerate the possibilities, and I readily admit to the strong bias of someone with a significant long position. Still, it seems to me that the accounting rules as applied here misrepresent, distort, and obscure what is going on. The impact of this very poor rule is made worse because it is happening in a period where people tend to believe the worst and are easily panicked, and not using their C-system.
I am even more disturbed by what appears the apparent conclusion that people have been able to use this distortion to make money on the short side. There has been a great deal of discussion in the press and on TV about the risk associated with writing these puts, there has been minimal talk about what Buffett’s C-system can do with this very nice long-tailed float, a point of view that to me is precisely ass-backward.
I am happy when I see Buffett say, “Berkshire Hathaway presently holds lots of financial derivative contracts,” because while they have indeed been weapons of mass destruction, in the hands of Buffett’s C-system, they will become weapons for rapidly expanding Berkshire Hathaway’s bottom line.