Berkshire Hathaway Look Through Earnings
Portfolio manager’s Letter June 2011
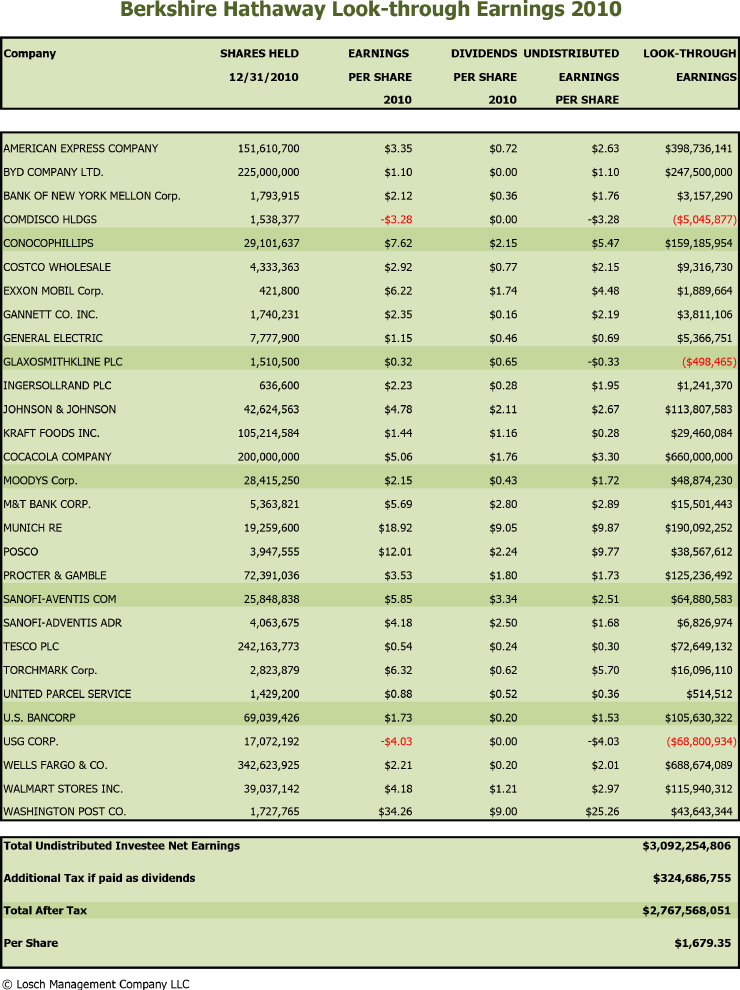
Berkshire Hathaway Look Through Earnings 2010
Attached is a table of Berkshire Hathaway Look Through Earnings 2010 year. The total was $1,680 per “A” share for 2010 that is up from $1,130 in 2009, or about 49%. Net after tax for 2010 was $7,928 per share so if we add in the look-through portion it would add to $9,607 and a PE of 11.8 as June 6.
These figures are approximate because they are based on Berkshire Hathaway’s holdings as of December 31, 2010, and so give no consideration for portfolio changes during the year.
Below is a list of Berkshire Hathaway PE ratios for the years for which I have figures. (Per share net plus Berkshire Hathaway Look Through Earnings 2010 with Berkshire Hathaway PE based on price of 12/31).
Berkshire Hathaway PE w/ Berkshire Hathaway Look Through Earnings 2010
|
Year |
Berkshire Hathaway Look Through Earnings 2010 |
Per Share Earnings |
Per Share + Berkshire Hathaway Look Through Earnings 2010 |
Price 12/31 |
PE |
| 1997 | $602 | $1,542 | $2,144 | $46,000 | 21.5 |
| 2002 | $606 | $2,795 | $3,401 | $72,750 | 21.4 |
| 2003 | $565 | $5,309 | $5,874 | $84,250 | 14.3 |
| 2004 | $690 | $4,753 | $5,443 | $87,900 | 16.1 |
| 2005 | $918 | $5,538 | $6,456 | $88,620 | 13.7 |
| 2006 | $1,222 | $7,144 | $8,366 | $109,900 | 13.1 |
| 2007 | $1,507 | $8,548 | $10,055 | $141,600 | 14.1 |
| 2008 | $11 | $3,224 | $3,213 | $96,600 | 30.1 |
| 2009 | $1,127 | $5,193 | $6,320 | $99,200 | 15.7 |
| 2010 | $1,679 | $7,928 | $9,607 | $119,500 | 12.4 |
| 6/15/2011 | $9,607 | $113,052 | 11.8 |
A long term view
But from where we are today, I feel comfortable foreseeing high single digit returns over the next 5 to 6 years. I am not projecting that these returns will go in a straight line, we might even have a recession somewhere during the next five years, but over this time frame I think a high single digit annualized return is very possible.
Once we get beyond the 5 to 6 year time frame, I believe America has the possibility of entering into a major bull market for stocks that could be very exciting. It could rival any major bull market we have seen. In the long run the world should continue to benefit from an emerging middle class in developing nations. To provide some perspective, the U.S. created $36 trillion in wealth on 300 million people in 20 years.
Can you imagine the wealth that will be created over the next 20 years when you add China and India’s 2 billion plus people to the list of consumers? Losch Management Company large cap multinational companies derive 53% of their sales from overseas and will benefit from these growing markets.
Arnold Van Den Berg
I found this quote on the internet and since it closely matches my view of the long term prospects for the market I thought I would copy it here. We all know that predicting the future is perilous business, but in our business we have to do the best we can. It is likely that it will take a few years for us to work through our current debt problems, just as it took a good deal of time to beat inflation in the 1980’s. But the lessons learned from our economy’s pain and suffering will eventually make U.S. business more competitive, and allow them to sell a lot more product to this rapidly expanding world middle class.
Van Der Berg’s estimate of high single digit returns for the next five years is a considerable improvement over the last ten years, so let’s hope he is right. The average annual return of the S&P 500 for the ten years ending on 12/31/10 was less than one percent. For that period, Losch Management has beaten the S&P 500 by 6% annually. We see no reason that we will not be able to continue this record, so there is a good chance that the next five years will be better than the last ten.