Berkshire Hathaway Second Quarter 2006
Portfolio manager’s Letter August 2006
Berkshire Hathaway Second Quarter 2006 Earnings
Warren Buffett says that lumpy earnings do not brother him, and it’s a good thing because Berkshire Hathaway’s earnings are lumpier than a sack full of cats. While this is not a problem for Warren Buffett it clearly is a problem for Mr. Market. This poor soul, obviously to busy to read Berkshire Hathaway’s financial statements, has no clue, earnings are up or earnings are down but what does it mean? With all those lumps?
Some of the lumps come from the gain from the sale of investments like the $5.07 billion in the fourth quarter of 2005 compared to the $167 million in the Berkshire Hathaway second quarter 2006. Or a lump may be caused by catastrophic insurance losses that can be next to non-existent for a year or two then jumps to $3.5 billion as in 2005.
Anyway you can see what I mean, how do you figure the underlining trend in earnings growth with all these lumps hiding the trend? The most interesting thing about the Berkshire Hathaway second quarter 2006 report was that there were practically no lumps. This is about as close to core earnings as you are ever going to see on a Berkshire Hathaway 10Q. The story told by this report is very interesting, and to try to find the underling trend I will compare this Berkshire Hathaway second quarter 2006 to the second quarter of 2001.
Lots to Like in Berkshire Hathaway Second Quarter 2006
It turns out that this is fairly easy because almost everything in this Berkshire Hathaway second quarter 2006’s earnings is recurring. We will use pre-tax earnings from the table on page 19 because of the detail provided in this table and because what we are trying to measure here is the trend of growth not value of the stock. Pre-tax earnings from the table were $3.6 billion; the only lump that I see is investment gains and losses of $459 million.
So we will subtract that figure and say core pre-tax earnings for the Berkshire Hathaway second quarter 2006 were $3.143. This includes $131 billion (a full Berkshire Hathaway second quarter 2006) from PacifiCorp but does not include anything from third quarter acquisitions ISCAR and Russell. Otherwise, it is a reasonably typical Berkshire Hathaway second quarter 2006 with underwriting profit down 70 million at GEICO and up to $66 million at GenRe. Of the operating companies, building products, financial products, shaw, flight services, and “other” were strong; apparel was weak, while McLane and retail were flat.
2001
For the second quarter of 2001 pre-tax was $1.267 billion, but there were more lumps. First, there was $648 million in investment gain so we have to remove that to get to core earnings. There were three loss items that were not recurring so we will add these numbers back in. In the insurance business there was $137 million write off for prior year losses at GenRe, and $104 million loss for retroactive insurance at Berkshire Hathaway RE. Also there was a $167 change for amortizing goodwill, so $1267 – $648 + (137 + 104 + 167) leaves us with core earnings for the second quarter of 2001 of $1.027 billion.
Ignoring the lumps, Berkshire Hathaway’s quarterly pre-tax earnings have grown from $1.027 billion to $3.143 in this five year period. The rate of growth has been almost exactly 25% per year. Now, as most people will have noticed the price of the stock seems to have lagged this pace of earnings growth. On June 30, 2001 Berkshire Hathaway was selling for $69,200, and at $91,659 on June 30 of this year Mr. Market has bid the price of our stock up by something less that 5.8% per year. We can, as has been suggested, take Mr. Market’s word for it, and accept today’s price as an adequate measure of the company’s value. But 25% earning growth for five years would seem to merit more respect.
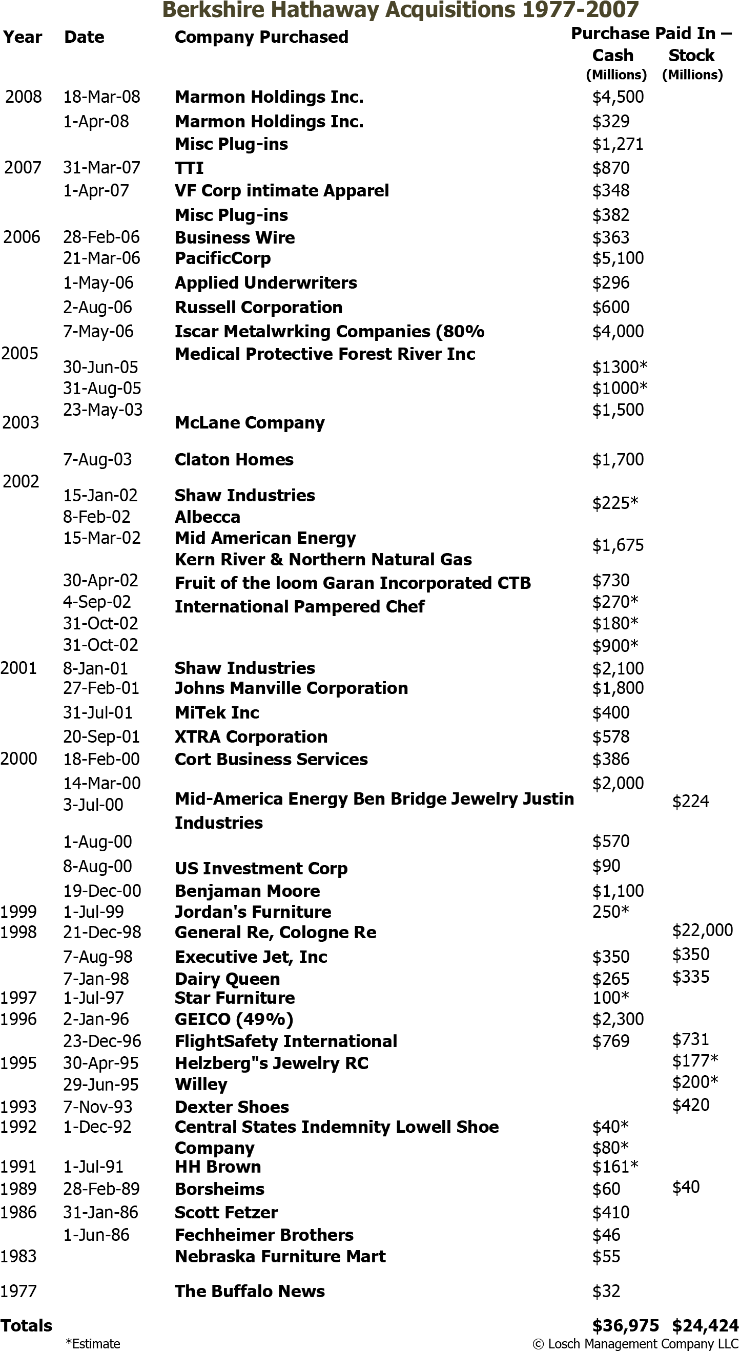
It is not likely that Berkshire Hathaway will be able to maintain that growth for the next five years, but that does not mean that the company will not grow faster that the broad market averages. In the five years since June 30 2001 Warren Buffett has spent a total of $14.9 billion in acquiring 15 companies. With approx $41.6 in cash and $26.6 billion bonds on hand today, it is not the lack of funds that will slow growth. Notice also that Berkshire Hathaway cash flow into Omaha three times as fast today as it was five years ago.
Berkshire Hathaway Second Quarter 2006 The Good News
There was lots of good news in Berkshire Hathaway second quarter 2006 report. Here are my favorite parts.
- GenRe’s underwriting profit more than doubled as they continued to write less and less business. Maybe there is a message in this?
- PacifiCorp earned $131 pre tax, which means that Warren Buffett is still able to achieve his goal for acquisitions of a 10% pre-tax return on their investment.
- Berkshire Hathaway spent $5.759 billion for acquisition in the first six months, purchased a net of $3.067 billion in equities, and spent $1.830 on purchases of property, plant and equipment, or a total of $10.656 on expansion in 6 months; yet cash and cash equivalents on June 30 was only down $3.204 billion from December 31, 2005 from $40.471 billion to $37.269 billion. Omaha Magic in Berkshire Hathaway Second Quarter 2006 results?
- Premiums written for catastrophe and individual risk insurance at Berkshire Hathaway RE were up 110% for six months. This is likely to get better in the third quarter as a lot of cat policies are renewed on July 1. Baring bad storms we likely will see much higher underwriting profit though the rest of this year and for all of 2007.
- $1.830 billion on purchases of property, plant and equipment for it’s existing businesses. That’s a lot of internal expansion and means that Berkshire Hathaway is not completely dependent on acquisitions for growth at its operating companies. This number is going to get a bigger with the addition of PacifiCorp and ISCAR.
The Market
Even thought the current market correction is only about three months old. We are starting to find some attractive prices. Examples are Gentex and Heartland Express; both of these companies have been affected negatively by current conditions. It seems that the only chance we get to make intelligent purchases any more is when a good company has problems.
Gentex has been affected by Problems at its biggest customer (General Motors); and Heartland Express by high prices for diesel fuel. We have owned both of these companies profitably in the past and they are currently selling near the low end of the long term valuation range. Both companies are debt free, have large cash balances; and a strong record of stock buy backs. Similar results to Berkshire Hathaway Second Quarter 2006.
While I expect the market to continue lower long term it is oversold now and due for a bounce. It is very hard to pick the eventual bottom, so when the values are attractive; it makes sense to commit some money.