Berkshire Hathaway Cash Flow
Portfolio manager’s Letter February 2008
This is an attempt to establish the importance of insurance float in any attempt to Value Berkshire Hathaway; we will use Buffett’s two column approach to attempt to understand the company’s current value. Table 1 lists principle sources Berkshire Hathaway cash flow for the last twenty-one years. The table includes estimates of the results in 2007.
21 Years Berkshire Hathaway Cash Flow
Net Earnings Plus Growth of Float (Millions of Dollars)
| Operating Income | Investment Gains | Net After Tax earnings | Float | Float Growth | Cash Flow | |
| 1985 | $390 | |||||
| 1986 | $798 | |||||
| 1987 | $215 | $20 | $235 | $1,267 | $469 | $704 |
| 1988 | $313 | $86 | $399 | $1,497 | $230 | $629 |
| 1989 | $300 | $148 | $448 | $1,541 | $44 | $492 |
| 1990 | $371 | $23 | $394 | $1,637 | $96 | $490 |
| 1991 | $314 | $124 | $438 | $1,895 | $258 | $696 |
| 1992 | $407 | $36 | $443 | $2,290 | $395 | $838 |
| 1993 | $834 | $363 | $1,197 | $2,625 | $335 | $1,532 |
| 1994 | $665 | $62 | $727 | $3,056 | $431 | $1,158 |
| 1995 | $670 | $118 | $788 | $3,607 | $551 | $1,339 |
| 1996 | $884 | $1,605 | $2,489 | $6,702 | $3,095 | $5,584 |
| 1997 | $1,197 | $704 | $1,901 | $7,386 | $684 | $2,585 |
| 1998 | $1,277 | $1,553 | $2,830 | $22,754 | $15,368 | $18,198 |
| 1999 | $671 | $886 | $1,557 | $25,298 | $2,544 | $4,101 |
| 2000 | $936 | $2,392 | $3,328 | $27,871 | $2,573 | $5,901 |
| 2001 | -$47 | $842 | $795 | $35,508 | $7,637 | $8,432 |
| 2002 | $3,903 | $383 | $4,286 | $41,224 | $5,716 | $10,002 |
| 2003 | $5,422 | $2,729 | $8,151 | $44,220 | $2,996 | $11,147 |
| 2004 | $5,049 | $2,259 | $7,308 | $46,094 | $1,874 | $9,182 |
| 2005 | $4,998 | $3,530 | $8,528 | $49,287 | $3,193 | $11,721 |
| 2006 | $9,306 | $1,709 | $11,015 | $50,887 | $1,600 | $12,615 |
| 2007 | $9,800* | $4,400* | $14,200* | $59,000* | $8,113* | $22,313* |
| $47,485 | $23,972 | $71,457 | $58,202 | $129,659 |
* – 2007 Figures are Estimates
| Five Year Growth Rate | 17.40% |
| Ten Year Growth Rate | 24.05% |
| Twenty Year Growth Rate | 19.54% |
It shows that Berkshire Hathaway’s total income from its operating businesses for the twenty-one years was $47.5 billion, Investment gains were $23.9 billion, and Berkshire Hathaway cash flow received by way of the increase in the float of its insurance business totals $58.2 billion. In other words, over the last twenty-one years 45.0% of all cash generated by the company has come from insurance float. In addition this table shows very clearly that the company’s intrinsic value has grown very rapidly in the last three years. Finally as we study the amount of Berkshire Hathaway cash flow generated by insurance business it is easier to see that most people do not understand the size and strength of Mr. Buffett’s Insurance Empire.
Berkshire Hathaway Cash Flow Spending on Investments
The Table of Expenditures is simply an attempt to help us understand what Berkshire Hathaway would look like if there had been no insurance float. Without the $50 billion generated by the float the company clearly would have had a lot less money to invest and would be much smaller. With this table, I did not attempt to estimate figures for 2007, and it represents only a rough attempt to understand how the Berkshire Hathaway cash flow from the float may have been used.
21 Years of expenditures of Berkshire Hathaway Cash Flow
(Millions of Dollars)
| Year | Net Equity Purchases (Sales) | Cash Business Acquistions | Capital Expenditure | Deprecation | Capital Expenditure Net of Depreciation |
| 1987 | $372 | $0 | $18 | $27 | -$9 |
| 1988 | $1,605 | $0 | $18 | $27 | -$9 |
| 1989 | -$82 | $0 | $43 | $29 | $14 |
| 1990 | $467 | $0 | $34 | $31 | $3 |
| 1991 | $287 | $161 | $30 | $33 | -$3 |
| 1992 | $813 | $120 | $32 | $35 | -$3 |
| 1993 | -$330 | $0 | $35 | $41 | -$6 |
| 1994 | $1,583 | $0 | $67 | $50 | $17 |
| 1995 | $107 | $0 | $54 | $60 | -$6 |
| 1996 | -$108 | $3,069 | $82 | $88 | -$6 |
| 1997 | -$1,302 | $775 | $242 | $144 | $98 |
| 1998 | -$3,003 | $615 | $399 | $155 | $244 |
| 1999 | -$691 | $153 | $530 | $218 | $312 |
| 2000 | -$2,725 | $3,798 | $630 | $282 | $348 |
| 2001 | -$2,806 | $4,697 | $811 | $544 | $267 |
| 2002 | $350 | $2,620 | $928 | $679 | $249 |
| 2003 | -$1,317 | $3,213 | $1,002 | $829 | $173 |
| 2004 | -$578 | $414 | $1,278 | $941 | $337 |
| 2005 | $6,392 | $2,387 | $2,195 | $982 | $1,213 |
| 2006 | $5,395 | $10,132 | $4,571 | $2,066 | $2,505 |
| 2007 | $11,057 | $1,600 | $5,373 | $2,407 | $2,966 |
| 20 Year Totals | $15,486 | $33,754 | $18,372 | $9,668 | $8,704 |
Total Cash Expenditures – 12/31/2007
| Equity Cost Basis | $39,252 |
| Business Acquistions | $33,754 |
| Net Capital Expenditures | $9,668 |
| Cash on Hand | $43,761 |
| Total Expenditures | $126,435 |
For the period reviewed, the company spent $32.1 in Berkshire Hathaway cash flow on the purchase of wholly owned businesses, spent $5.6 billion on capital expenditures that were in excess of their deductions for depreciation, and as of 12/31/06 their cost basis on equity securities still held was $23.0 billion. If we add this to the above figures the total of these cash expenditures for the 20 year period is $60.7 billion ($23.0+$32.1+$5.6). Add the cash on hand on 12/31/2006 of $42.5 billion and the sum is 103.2 billion a result that is fairly close to the figure yielded by the Berkshire Hathaway cash flow table for the period ending in December 2006 ($107 billion).
It is difficult to escape the conclusion that Berkshire Hathaway cash flow would be a great deal smaller and less profitable today without its insurance float. The Berkshire Hathaway cash flow from this float would have paid for all of the company’s cash business acquisitions, with $18 billion left over. I believe that any attempt to value Berkshire Hathaway that does not include some effort to place a value on this float is a waste of time, and displays a serious lack of understanding of the company.
Yet we continue to see pundits ignore this issue. The recent Barron’s article said that Berkshire Hathaway was overpriced because it was selling a fifteen times earnings, but the authors did not take the trouble to place any value on Berkshire Hathaway’s float even though it provides almost 50% of the Berkshire Hathaway cash flow. This is certainly not the only example we have of sloppy work by people attempting to value Berkshire Hathaway, but it is the worst I can remember were the author rated a cover story in a major publication.
Buffett tried to address this issue early on with the concept of look-through earnings and more recently with his “Two column” Approach to valuing Berkshire Hathaway.
Berkshire Hathaway Two Column Valuations
Table 3 compares Buffett’s two column value with the actual market price on the last day of the years listed. This value is arrived at by adding together the value of investments and subtracting the cash held by the finance operation. The second yardstick in this valuation is the pre-tax earnings from the non insurance business. It excludes from operating earnings all investment earnings and any underwriting profit or loss. For this table I have used a multiplier of twelve to value these businesses.
Berkshire Hathaway 21 Year Two Column Valuation
It is interesting to look at the value for the years 1995 and 1996. In 1995 Buffett was quoted as saying the stock overpriced and the “Two Column” approach gives a value of $25,700 when the stock was trading in the mid thirties. The next year at the annual meeting Buffett said that intrinsic value had increased substantially while the market price of the stock had remained flat so than he and Charlie agreed that the stock was now reasonably priced. This is exactly what the table shows.
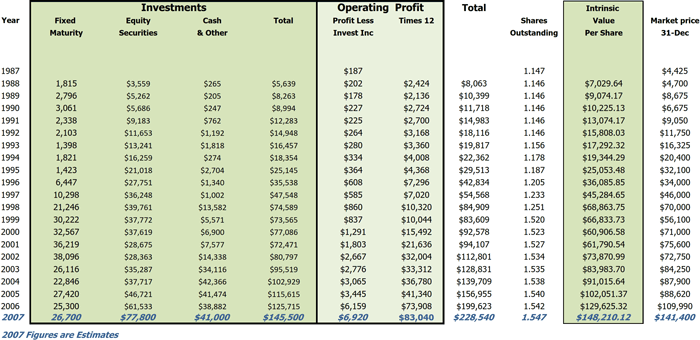
In 2000 when Buffett offered to buy stock at $45,000 the table values the company $49,300 indicating that this approach is conservative in view fact the Buffett’s offer was certainly made with a margin of safety significantly larger that the difference in these two figures. The biggest advantage of this method that I can see is that increases in Berkshire Hathaway’s cash flow from float show up immediately in the investment column. Using these values, Berkshire Hathaway registers the following annual growth rates for the company’s Intrinsic Value.
- 3 Years 17.7
- 5 Years 14.9
- 10 Years 12.6
- 15 Years 16.1
- 19 Years 17.4
In the future I doubt that the company will be able to sustain the growth of the last three years, or the last nineteen years. The company is now so big and that it will require larger and larger acquisitions to move the needle. Growth for the last ten years was 12.6% because the period included a long bear market, problems associated with the GenRe merger, and large reinsurance losses from 9/11, so may be a more reasonable expectation for the next five years. Beyond that the company will become so large (Five years of 13% growth would almost double the company’s present size) that further slowing of growth can be expected.