Bear Markets
Portfolio manager’s Letter November 2008
Bear Markets from 1924 to 2008
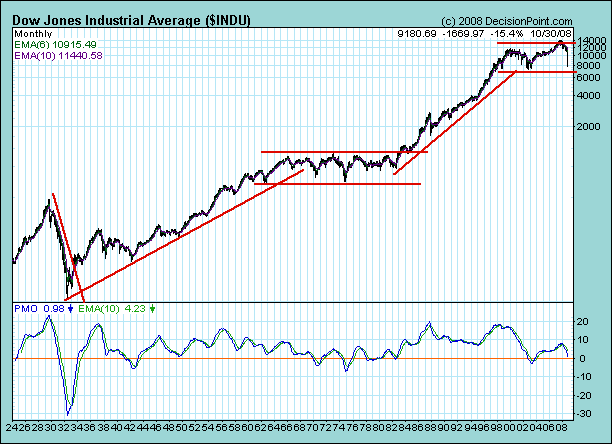
Now let’s take a look at some history in hopes of getting a little perspective on the current stock market. The chart below shows eighty-four year picture of the Dow Jones Industrial Average from 1924 to 2008. It comes from the Decision Point web site.
The chart nicely identifies two secular (long term) bull markets of the twentieth century. The chart also, very nicely identifies three secular bear markets starting with an 84% crash of the Dow in 1929 followed by the 1966 to 1982 bear and then our current secular correction that started in March 2000.
Investment manager knows from Hyman Minsky that long periods of prosperity create instabilities that require correction (see Portfolio manager’s Letter about Generational Events) so long bull markets will inevitably develop economic excesses that will eventually create a bear market.
Recently it has become popular to compare today’s market to the 1930’s, but it seems more likely that we are in a period that will play out like the seventies than the thirties. Governments (particularly central banks) are much more interventionist today than they were in the thirties, and this I think will help to make this generation’s correction more like the seventies.
Bear markets from January 1966 to August 1982
The table “Cyclical Bear Markets 1966 – 1982” shows that the period from January 1966 to August 1982 included six separate cyclical (short term) bear markets that ranged in severity from 21% to 50%. The average for these corrections was 28%. These bear markets lasted from 1 month to 22 months with an average duration of 15 months.
The economic problem that the country faced in the seventies was uncontrollable inflation. It was not an easily problem to solve. There was a lot of cost-push as unions and a tight labor market helped to keep labor costs escalating rapidly, and in the 1960s and early 1970s a Federal Reserve Board eager to keep the politicians happy with lots of easy money.
The seventies the roller coaster stock market was largely the result of the FED’s attempts to control inflation. The inflation would start to get nasty and the FED would tighten. The tightening would cause a recession and the FED would have to expand the money supply to fight unemployment. As soon as the economy started to recover the inflation would reappear the FED would tighten again; and so on.
Cyclical Bear Markets 1966 – 1982
| Top | Bottom | S&P 500 | Number of Months | Percent Change |
| January 1966 | 94.64 | |||
| October 1966 | 72.28 | 9 | -24% | |
| November 1968 | 109.09 | 25 | 51% | |
| May 1970 | 68.61 | 18 | -21% | |
| January 1973 | 121.74 | 32 | 53% | |
| October 1974 | 60.96 | 22 | -50% | |
| September 1976 | 108.72 | 24 | 78% | |
| March 1978 | 86.45 | 18 | -21% | |
| February 1980 | 120.22 | 23 | 39% | |
| March 1980 | 94.23 | 1 | -22% | |
| November 1980 | 141.95 | 9 | 51% | |
| August 1982 | 102.2 | 22 | -28% | |
| August 1987 | 337.89 | 60 | 231% |
In the 1970’s the inflation problem would not go away because prices had been steadily increasing since the beginning of WWII (26 Years) it took sixteen years and six bear markets before prices finally began to stabilize. The worst of these cyclical bear markets was the 1973 – 1974 market which very neatly cut the S&P 500 in half. This particular correction came about half way through the secular correction or about eight years in.
There were three more bear markets to come but in each case the low in the market was higher than the previous low, and each high was above the previous one. This was in spite of the fact that inflation kept getting worse that there were two recessions and an oil shock during the late seventies and early eighties.History does not repeat itself but economic cycles are a product of human nature, and that does not change. The problem we face today is too much debt, and I can think of no particular reason that we should expect that it will be easier to solve or that the solution will take less time than the problem we faced in the seventies. Although the market bottomed in 1974, it took ten years more years for inflation to finally cool off, and it was not until 1982 that the bull was really back in charge.
Market Comment
It may be that have yet to see the market lows, but what Losch Management Company is approaching is likely to be a generational low similar to what we saw in 1974. It is almost certain that stocks purchased at today’s levels will yield decent long term returns, but it may take a lot of patience and this particular window of opportunity may be short.
Massive stimulation by governments around the world will likely eventually lead to economic recovery and then to the reemergence of inflation. We can expect the kind continuing political pressure that will produce cycles like those we experienced in the late seventies. Equity prices are cheaper today that they have been for twenty-five years, but Mr. Market is very nervous, and who can blame him? If you are not nervous today it probably just means that you are not paying attention. Yet, bottom line is that this is a very good time to be buying equities and a very bad time to be selling.
It will take more than a couple of years to de-lever the world. That does not mean the market has to continue lower from here, but it does mean you have to be very careful to find a margin of safety when you invest, and be willing to sell at any sign of over-valuation. With these caveats I think that Losch Management Company results for the next five years will be better than the last five years, but not yet as good as what we experienced in the 1990’s.
The good news is that we may have survived the derivative explosion, and a lot of stupidity will be removed from the world’s financial markets. This is never a painless process but it always is beneficial in the long run.