• Home
  • About
  • Team
  • Contacts
  • Blog

Look-Through Earnings

  1. Home
  2. Blog
  3. Look-Through Earning ...

Portfolio manager’s Letter October 2005

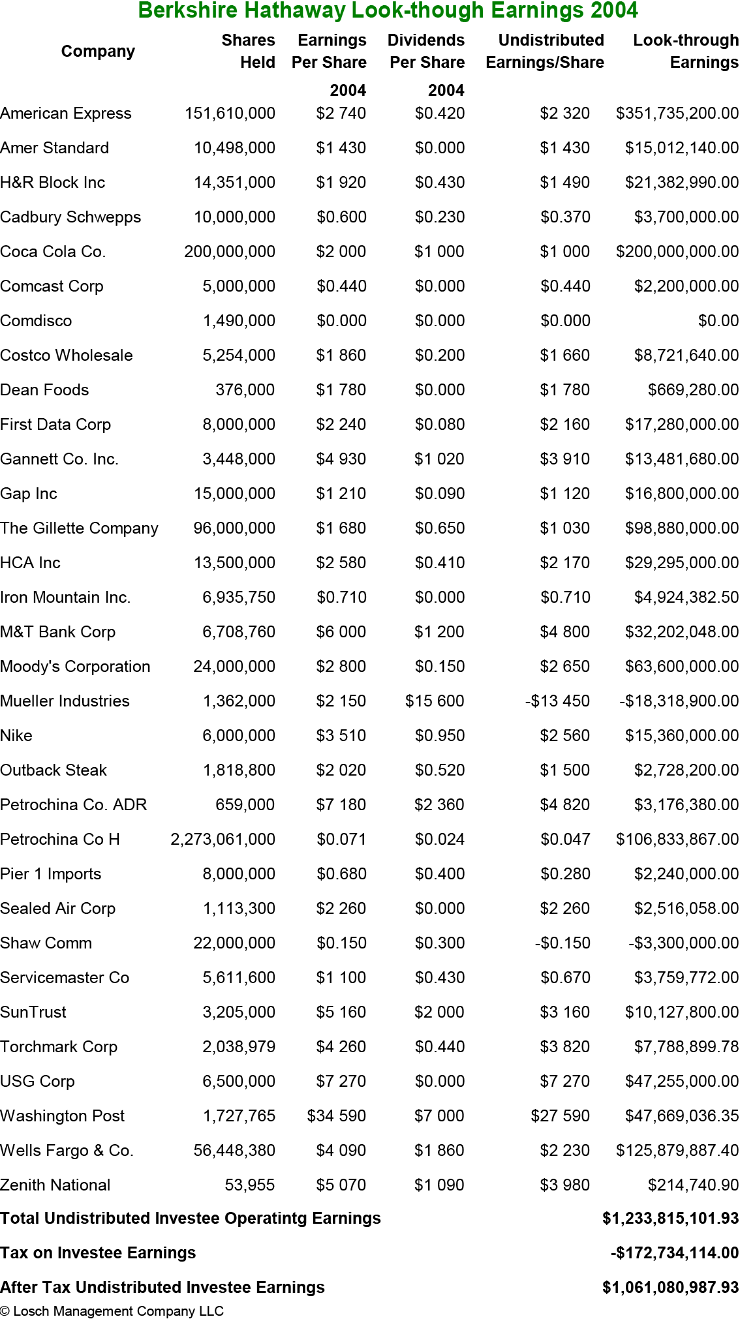
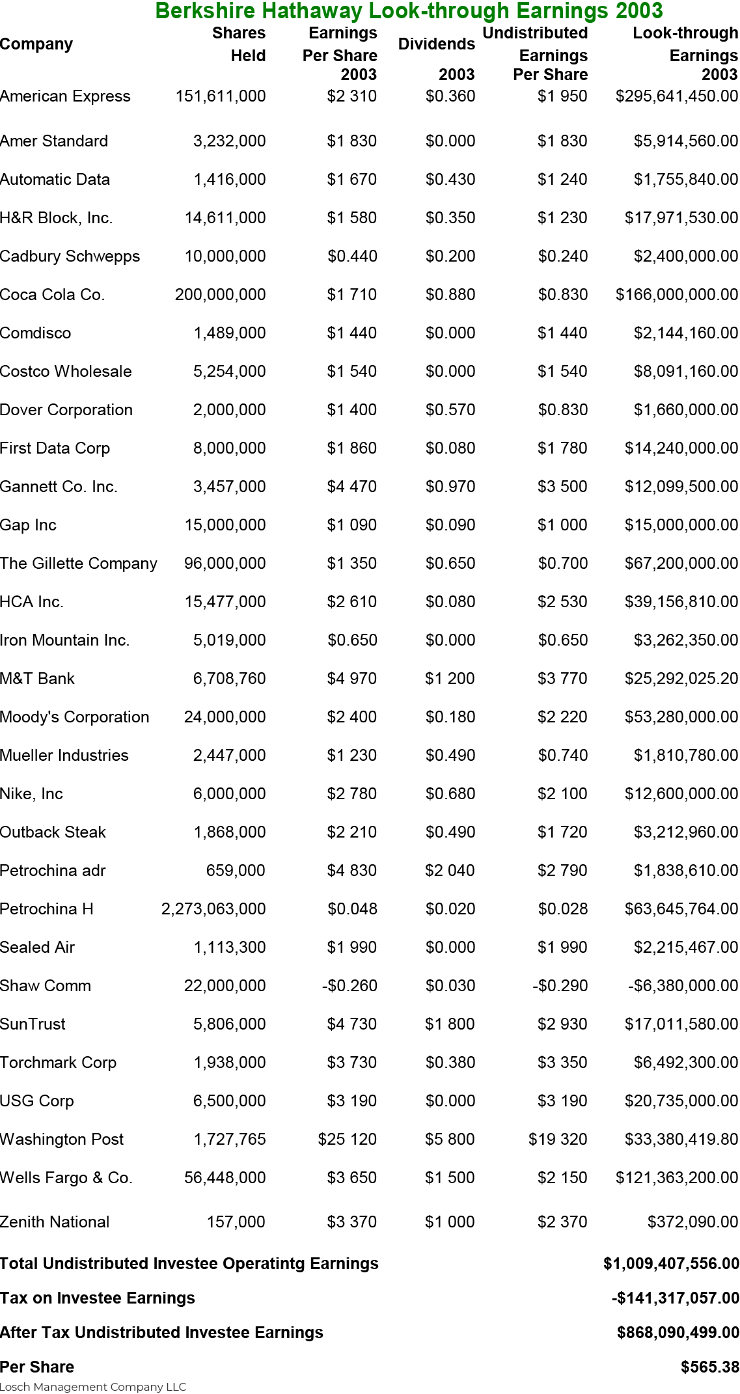
Berkshire Hathaway Look-Through Earnings 2003 – 2004

Below are tables that itemize the Berkshire Hathaway look-through earnings for the years 2003 and 2004. In his 1997 Chairman’s Letter, Warren Buffett explained look-through earnings as follows:

“Reported earnings are a poor measure of economic progress at Berkshire Hathaway, in part because the numbers shown in the table presented earlier include only the dividends we receive from investees — though these dividends typically represent only a small fraction of the earnings attributable to our ownership. Not that we mind this division of money, since on balance we regard the undistributed earnings of investees as more valuable to us than the portion paid out. The reason is simple: our investees often have the opportunity to reinvest earnings at high rates of return. So why should we want them paid out?

“To depict something closer to economic reality at Berkshire Hathaway than reported earnings, though, we employ the concept of look-through earnings. As we calculate these, they consist of: 1) the operating earnings reported in the previous section, plus; 2) our share of the retained operating earnings of major investees that, under GAAP accounting, are not reflected in our profits, less; 3) an allowance for the tax that would be paid by Berkshire Hathaway if these retained earnings of investees had instead been distributed to us.”

In 1997 Warren Buffett listed look-through earnings of $1.930 billion, which would have been $1,564 per share based on the 1,234,127 shares that were outstanding on December 31, 1997. This would mean that per share earnings growth for the seven year period was equal to 15.2% on an annual basis, for the period that includes both the purchase of General Re and 9/11.

During the same period, GE has grown its per-share earnings at an annual rate of 9.8%, and Microsoft at 15.8%. So, compared to the competition, Berkshire Hathaway has been doing all right. At a price of $83,000, Berkshire Hathaway’s trailing PE (for the 12 months ending 12/31/2004) would be 19.6. GE’s PE is 21.1 and Mr. Softy’s is 26.8.

But “Reported earnings are a poor measure of economic progress at Berkshire Hathaway.” This may not be quite as relevant today as it was in 1997, but it is still true. Indeed, look-through earnings are helpful but they still do not give anything close to a completely definitive window into Berkshire Hathaway’s intrinsic value.

The attached tables are based on operating earnings only and so ignore $5 billion in after-tax income that Berkshire Hathaway received in gains on its investments. Since 1997 Berkshire Hathaway has logged $18.2 billion in after-tax operating earnings compared to $11.9 billion in after-tax investment gain. While everyone knows that investment gains are not predictive of future economic progress that does not mean they are meaningless.

Income is still income, and the $11.9 billion from after-tax investment gain can be used to fund investments in the same manner as cash from operating income. When we say that Berkshire Hathaway’s trailing PE is 19.6, we are in effect ignoring $12 billion in historical earnings. The other problem with any earnings-based evaluation of Berkshire Hathaway is the company’s liquidity. The company has on its balance sheet $47 billion in cash, $22 billion in bonds, $41 billion in marketable equities, and $2 billion a quarter in new Berkshire Hathaway cash flow. With $110 billion and counting in liquid assets, the Berkshire Hathaway does not need it all to keep operating.

If we subtract $70 billion for debt and insurance obligations, you could probably remove $40 billion and not impair the on going status of the business. Remove $40 billion, or $26,000 per share, from the present market value and you are left with $57,000 per share and divide it by $4,222 per share earnings and it gives you a PE of 13.5. This is still ignoring the investment gains.

Granted the above process lacks a certain analytical neatness, and maybe 13.5 seems seem like a screwy number, but I like it better than 19.6 or 22 (which is what Standard&Poor’s says it is). The reason I like it is that I feel it gives a simple and reasonable picture of Berkshire Hathaway’s value relative to the over all market. Something that simply comparing operating earnings to the market price does not do.

Berkshire Hathaway Look-through Earnings 2003

Look-through Earnings 2003

Berkshire Hathaway Look-through Earnings 2004

Look-through Earnings 2004

10/01/2005


Leave a Reply Cancel Reply

Your email address will not be published.


Comment


Name

Email

Url


Blog Archive

2020

  • The Stock Market

2019

  • Behavioral Investing

2018

  • Trumped
  • Warren Buffett vs Wall Street
  • Globalism, 1982-2000 Bull Market

2017

  • Volatility Underlying Calm Market
  • What’s new with CB&I?
  • Passive Investing
  • Economic Cycles
  • Current Stock Market 2017 Comment

2016

  • Global Plastics Summit Highlights
  • Value Investing vs Index Investing
  • How to Play an Index Bubble
  • Successful Investors
  • Is the Market Overvalued?
  • Operating Earnings
  • Article by investment manager in Bay Hill Living
  • Building Foundation

2015

  • 3G Culture – Dream Big
  • Myopic Loss Aversion
  • CBI Nuclear Energy
  • St Joe Company
  • What’s in a Word? Plastics.
  • Are Bonds Safer Than Stocks?

2014

  • Chicago Bridge and Iron
  • CAMEX 2014
  • Global Economy October 2014
  • Fluor Corporation
  • Interesting Quotes from Daily Journal Annual Meeting
  • The Daily Journal Annual Meeting
  • Albemarle Corporation
  • Triumph Group
  • The American Energy Revolution
  • Singapore

2013

  • St Joe Company Update
  • Hedge Fund Managers
  • Triumph Group Inc.
  • Bitter Brew
  • An Antifragile Portfolio

2012

  • Leucadia National Corporation
  • This Time it is Different
  • Successful traders psychology
  • St Joe Company
  • Learning from Pain

2011

  • Long Cycles – Part II
  • Long Cycle
  • Nasty Month for Market
  • Make a Buck with Fortescue Metals Group
  • Berkshire Hathaway Look Through Earnings
  • St Joe Company Inc
  • Successful Investment Management
  • A Look Into Latin American Market
  • The Mother of all Quarters
  • 2010 Investment year results

2010

  • Fault Lines
  • US Market 2010
  • Berkshire Hathaway Third Quarter 2010
  • The Stock Market 2010
  • Berkshire Hathaway Second Quarter 2010
  • Berkshire Hathaway Performance
  • Long Term Greedy
  • Goldman Sachs
  • Berkadia and Leucadia
  • USG corporation
  • Berkshire Hathaway 2009 2010
  • Why Capitalism Works

2009

  • The Lords of Finance
  • The $44 Billion Dollar Train Set
  • Berkshire Hathaway 3rd Quarter 2009
  • Career Risk for Investment Manager
  • Berkshire Hathaway financial statements
  • Berkshire Hathaway Preferred Stock
  • Moral Hazard
  • Credit Default Swap
  • The Shadow Banking System
  • Learning Things the Hard Way
  • Our C-System
  • 2008 Investment results

2008

  • Investment Risk
  • Bear Markets
  • Generational Events
  • Orange sheets – Money is doing better
  • Inflation Not The Problem
  • Tipping Point
  • Long Term Capital Management
  • Financial Insurance
  • Western Refining Inc
  • Berkshire Hathaway Year To Date
  • Berkshire Hathaway Cash Flow
  • 2007 investment results

2007

  • Investment results 4th Quarter 2007
  • Greenspan on Inflation
  • Berkshire Hathaway Third Quarter 2007
  • Berkshire Hathaway Operating income 2007
  • Berkshire Hathaway Hedge Fund
  • Leveraged Buyouts
  • Stability Unstable
  • Weak Dollar
  • Berkshire Hathaway Chairman’s Letter
  • Steel Dynamics
  • Breakwater Resources
  • 2006 Investment year results

2006

  • New Investment Stocks
  • Equitas
  • Berkshire Hathaway Third Quarter 2006
  • Hurricane Synergy
  • Berkshire Hathaway Second Quarter 2006
  • Fat Pitch
  • Perfectly Obvious
  • Berkshire Hathaway Growth Rate
  • Berkshire Hathaway First Quarter 2006
  • Berkshire Hathaway Annual Report 2006
  • Inflation Is
  • 2005 Investment year results

2005

  • Exogenous Events
  • The Easy Money
  • Look-Through Earnings
  • High-Risk Mortgages
  • Unintended Consequences
  • Rydex Ursa Fund
  • Warren Buffett Premium
  • Private Equity
  • Latticework Mental Models
  • Buffett’s Lackluster Performance
  • 2004 Investment year results
  • Professor Smith’s Second Bubble

2004

  • Hedging Currency Disaster
  • Risk Assessment
  • Too Many Bears
  • The Chinese Century?
  • Patterned Irrationality
  • Timber
  • Costco’s Cash
  • Physics Envy by Charlie Munger
  • Asset Allocation Berkshire Hathaway
  • The Balance of Payments
  • 2003 Investment year results

2003

  • Hedge Funds
  • The trade deficit is not debt
  • Secular Bear Market
  • Which Index Funds?
  • A Different Drummer
  • Costco’s Float
  • The Power of Float
  • Berkshire Hathaway Annual Meeting 2003
  • Psychology of Human Misjudgment
  • Sitting on the Sidelines
  • Berkshire Hathaway intrinsic value
  • 2002 Investment year results

2002

  • Insurance company Moats
  • Bond Bubble
  • Berkshire Hathaway Cash Flow 2002
  • Behavioral Economics
  • The Bear Market 2002
  • Greenspan Put
  • Second Quarter Cash Flow at Berkshire Hathaway
  • Berkshire Hathaway Annual Meeting 2002
  • Red Wire – Green Wire
  • Stupid FED Tricks
  • The Bottom Line
  • 2001 Investment year results

2001

  • Don’t Fight the FED
  • Buy and Hold? – It all Depends
  • Ben Laden and Berkshire Hathaway
  • The Dinosaurs Dance
  • Costco Moat
  • Bubble Watching
  • Sit on your Ass investing
  • Berkshire Hathaway Annual Meeting 2001
  • Carnival Cruise Lines
  • 450000 Square Ft Furniture Store
  • Lunch Money Indicators – Annual report
  • Other People’s Money

2000

  • Bear Tracks
  • Build It and Money Will Come
  • Efficient Stock Market
  • Style Drift
  • Lunch Money Indicators – Options
  • Identifying Problems
  • Small Retail Stocks
  • Charlie Munger comments
  • Big Al and the Bubble Machine
  • Berkshire Hathaway Cheap
  • Index Funds
  • 16 rules for investment success
Make an appointment or contact us by phone: +1 (689) 246 49 49
© 1999 - 2022 Losch Management Company
Support by Global AGM