Berkshire Hathaway financial statements
Portfolio manager’s Letter August 2009
Orange Berkshire Hathaway financial statements

July was a good month thanks to Berkshire Hathaway, and the rally continued the first week of August in anticipation of Berkshire Hathaway’s Earnings report on August 7, 2009. The orange Berkshire Hathaway financial statements I have included show your portfolio results as of the market close on August 7.
For your light summer reading I have included the annual update of some of Berkshire Hathaway financial statements. Please ignore the sex and violence.
Berkshire Hathaway financial statements: equity purchases and sales
This Berkshire Hathaway financial statements compares Berkshire’s purchases and sales of equity securities and shows the annual balance of purchases or sales. These figures are taken from the Berkshire Hathaway Cash Flow Statements. It also lists realized capital gains for each year covered. What is interesting about this Berkshire Hathaway financial statements is what it shows us about Buffett’s buying and selling patterns. From 1995 through 2004 Buffett was consistently selling equities on balance. From 2005 to present Buffett has been buying heavily on balance. While this does not demonstrate great skill in market timing, it probably has something important to say about the relative value of large cap American Equities.
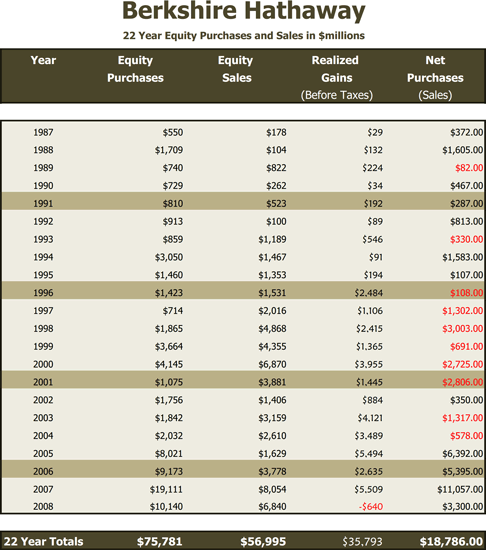
In 2008 Buffett cut way back on Equity Purchases and switched to preferred stocks with and equity kickers where he was able to get very high yields that are almost tax free because dividends are taxed at a 7% when paid to a corporation. Berkshire Hathaway has also increased its purchases of corporate debt as the credit crisis raised interest rates to levels where they offered a better return that could be expected from high quality equities.
Berkshire Hathaway financial statements: operations earnings and capital gains
This Berkshire Hathaway financial statements compares after tax income from operations each year and adds to this after-tax realized capital gains to show that while Buffett says that that realized gains have no predictive value as to future earnings they are never-the-less important to Berkshire Hathaway as one source of cash which can be used for investments. For the twenty-two years covered by this table after-tax gains on equity investments have totaled $22.9 billion or 29% of Berkshire Hathaway’s after tax earnings. They have generated enough cash to pay for 62% of Berkshire Hathaway’s acquisitions or all of the company’s net equity purchases with a few billion left over.

Berkshire Hathaway financial statements: pre-tax operating earnings
This Berkshire Hathaway financial statements is a 22 year history of pre-tax earnings for Berkshire Hathaway operating businesses With Underwriting Gain and Investment Income listed for the Insurance Business, and compared to the pre-tax Income of Berkshire Hathaway’s other operating businesses.
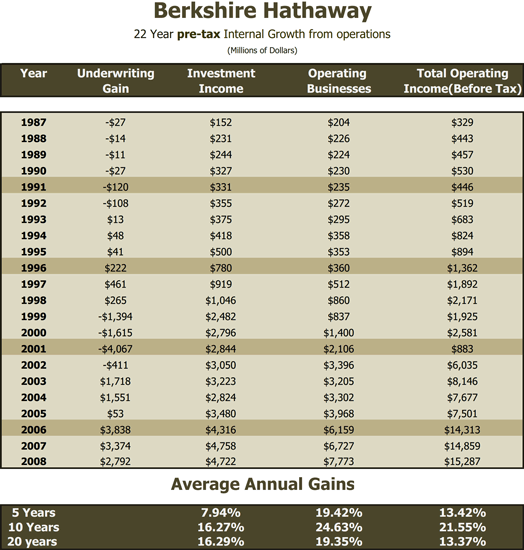
This is an attempt to estimate an intrinsic growth rate for Berkshire Hathaway by looking at the individual pieces. Total pre-tax operating income has grown by 13.4% annually for the last five years, and 21.6% annually for the last 10 years. We cannot expect the company to match this 21% growth rate in the future because a lot of past growth has come through acquisitions. Berkshire Hathaway’s size means that it will be difficult to add businesses that are big enough to move the needle that far. However, the five year figure of 13% may not be out of reach since the last two years have included the longest recession since the 1930’s and an economic recovery will add to earnings growth at the subsidiaries.
It is interesting to note that there has been an underwriting profit of $10 billion in the last three years which means that the $58 billion in float is not only free, but that Berkshire Hathaway is being paid very well to hold it. From this free float in the last three years Berkshire Hathaway has earned $13.8 billion in investment income and $7.5 billion realized gains from its investments. Buffett has got his business plan working quite nicely.
Berkshire Hathaway financial statements: acquisitions 1986 — Present
This Berkshire Hathaway financial statements is a list of companies that Berkshire Hathaway has purchased since 1986. The total cash spent on purchases of in the last 22 years is $36.9 billion.
Berkshire Hathaway Acquisitions 1977 – 2007
| Year | Date | Company Purchased | Purchase Cash (Millions) | Paid In Stock (Millions) |
| 2008 | 18-Mar-08 | Marmon Holdings Inc. | $4,500 | |
| 1-Apr-08 | Marmon Holdings Inc. | $329 | ||
| Misc Plug-ins | $1,271 | |||
| 2007 | 31-Mar-07 | TTI | $870 | |
| 1-Apr-07 | VF Corp intimate Apparel | $348 | ||
| Misc Plug-ins | $382 | |||
| 2006 | 28-Feb-06 | Business Wire | $363 | |
| 21-Mar-06 | PacificCorp | $5,100 | ||
| 1-May-06 | Applied Underwriters | $296 | ||
| 2-Aug-06 | Russell Corporation | $600 | ||
| 7-May-06 | Iscar Metalwrking Companies (80%) | $4,000 | ||
| 2005 | 30-Jun-05 | Medical Protective | $1300* | |
| 31-Aug-05 | Forest River Inc | $1000* | ||
| 2003 | 23-May-03 | McLane Company | $1,500 | |
| 7-Aug-03 | Claton Homes | $1,700 | ||
| 2002 | 15-Jan-02 | Shaw Industries | $324 | |
| 8-Feb-02 | Albecca | $225* | ||
| 15-Mar-02 | Mid American Energy | |||
| Kern River & Northern Natural Gas | $1,675 | |||
| 30-Apr-02 | Fruit of the loom | $730 | ||
| 4-Sep-02 | Garan Incorporated CTB International | $270* | ||
| 31-Oct-02 | Pampered Chef | $180* | ||
| 31-Oct-02 | $900* | |||
| 2001 | 8-Jan-01 | Shaw Industries | $2,100 | |
| 27-Feb-01 | Johns Manville Corporation | $1,800 | ||
| 31-Jul-01 | MiTek Inc | $400 | ||
| 20-Sep-01 | XTRA Corporation | $578 | ||
| 2000 | 18-Feb-00 | Cort Business Services | $386 | |
| 14-Mar-00 | Mid-America Energy | $2,000 | ||
| 3-Jul-00 | Ben Bridge Jewelry | $224 | ||
| 1-Aug-00 | Justin Industries | $570 | ||
| 8-Aug-00 | US Investment Corp | $90 | ||
| 1999 | 19-Dec-00 | Benjaman Moore | $1,100 | |
| 1-Jul-99 | Jordan’s Furniture | $250* | ||
| 1998 | 21-Dec-98 | General Re, Cologne Re | $22,000 | |
| 7-Aug-98 | Executive Jet, Inc | $350 | $350 | |
| 7-Jan-98 | Dairy Queen | $265 | $335 | |
| 1997 | 1-Jul-97 | Star Furniture | $100* | |
| 1996 | 2-Jan-96 | GEICO (49%) | $2,300 | |
| 23-Dec-96 | Flight Safety International | $769 | $731 | |
| 1995 | 30-Apr-95 | Helzberg’s Jewelry | $177* | |
| 29-Jun-95 | RC Willey | $200* | ||
| 1993 | 7-Nov-93 | Dexter Shoes | $420 | |
| 1992 | 1-Dec-92 | Central States Indemnity | $40* | |
| Lowell Shoe Company | $80* | |||
| 1991 | 1-Jul-91 | HH Brown | $161* | |
| 1989 | 28-Feb-89 | Borsheims | $60 | $40 |
| 1986 | 31-Jan-86 | Scott Fetzer | $410 | |
| 1-Jun-86 | Fechheimer Brothers | $46 | ||
| 1983 | Nebraska Furniture Mart | $55 | ||
| 1977 | The Buffalo News | $32 | ||
| Totals | $36,975 | $24,424 | ||
| *Estimate |
There is nothing much new here. If there was a disappointment for me in 2008 it was that Buffett was not able to bag any new wholly owned operating companies. The most interesting thing for 2008 from this table is the $1.3 billion in Bolt-on acquisitions. This is quite a large number for bolt-ons, and is to some extent a change in philosophy because Berkshire Hathaway is not necessarily leaving the old company intact but is merging the acquisition into an existing subsidiary. Losch Management Company do not get any detailed information on these purchases, but I would assume that a lot of it is going on at ISCAR.
This $1.3 billion together with the $6.1 billion in Cap Ex spending in 2008 would lead us to the conclusion that internal growth will become more important for Berkshire Hathaway in the future.