• Home
  • About
  • Team
  • Contacts
  • Blog

Asset Allocation Berkshire Hathaway

  1. Home
  2. Blog
  3. Asset Allocation Ber ...

Portfolio manager’s Letter March 2004

I have taken his table “Asset Allocation Berkshire Hathaway” and added a couple of columns on the left side to cover the period that included the 1996 acquisition of GEICO. The result is a dramatic representation of Warren Buffett’s move away from the equity market. The move is very Warren Buffett in that the shift is massive, but it was handled in such a way that unless you are really paying attention you would not notice. This table tells us better than mere words what is going on in Warren Buffett’s mind.

Notice the sharp increase in cash in 2003 year and a dramatic sell-off of the company’s holdings of debt. This is a very clear indication of Mr. Warren Buffett’s feelings about the bond market. The large holdings of cash (that yield less than 1%) must be painful to some one that likes to get 10% after-tax, and so speaks volumes about present lack of attractive investments.

Table One – Asset Allocation Berkshire Hathaway

Asset Class by Percent

Asset Allocation Berkshire Hathaway

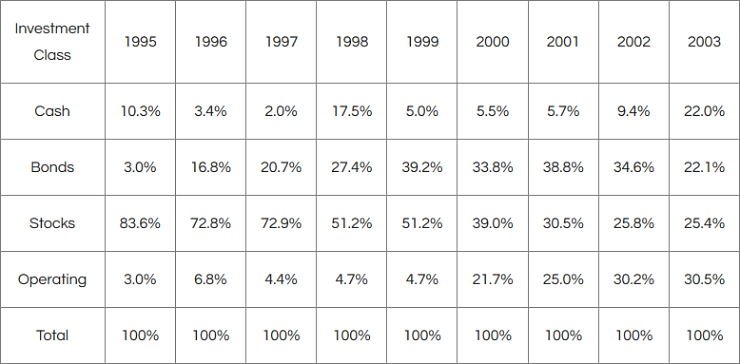
In 1995 the total value of the equity portfolio was $21 billion compared to something north of $35 billion today. But as you can see from table one, Warren Buffett has been able to drastically reduce Berkshire Hathaway’s exposure to the risk of a decline in the equity market.

Table two indicates that 2002 was the first year of on-balance stock purchases since 1996, but the amount of purchases were not significant; it was mostly caused by lack selling. The main reason for the lack of sales in 2002 was probably the market decline. In last years annual report he said that stock values where still not attractive, but his actions show that in 2002, while he still was not buying, at least values where such that he had just about stopped selling.

Warren Buffett’s method of fashioning this radical restructuring of Berkshire Hathaway’s assets is very complicated but fascinating. There has been some liquidation of equity positions. Table two indicates that Berkshire Hathaway liquidated, on balance, about $10.2 billion in equities since 1995.

Table Two – Berkshire Hathaway – 16 Year Equity Purchases

Year Equity Purchases Equity Sales Realized Gains Net Purchases (Sales)
2002 $1,756 $1,406 $637 $350.00
2001 $1,075 $3,881 $1,363 $2,806.00
2000 $4,145 $6,870 $3,955 $2,725.00
1999 $3,664 $4,355 $1,365 $691.00
1998 $1,865 $4,868 $2,415 $3,003.00
1997 $714 $2,016 $1,106 $1,302.00
1996 $1,423 $1,531 $2,484 $108.00
1995 $1,460 $1,353 $194 $107.00
1994 $3,050 $1,467 $91 $1,583.00
1993 $859 $1,189 $546 $330.00
1992 $913 $100 $89 $813.00
1991 $810 $523 $192 $287.00
1990 $729 $262 $34 $467.00
1989 $740 $822 $224 $82.00
1988 $1,709 $104 $132 $1,605.00
1987 $550 $178 $29 $372.00
16 Year Totals $25,462 $30,925 $14,856 $5,463.00

But, the major influence on the change in the asset balance has been the acquisition of GEICO and GenRe with their large bond portfolios, and the acquisition of complete companies in the last five years.

List of Berkshire Hathaway’s Holdings

We have completed our update of the list of Berkshire Hathaway’s holdings for 2003 taken from the companies 13F filings with the SEC. The list shows a small but steady liquidation of the equity portfolio in 2003. People have said, and I agree, that most of the buying and selling that appears now on Berkshire Hathaway’s 13Fs are the work of Lou Simpson. In any event, the year-long rally in 2003 appears to have driven Berkshire Hathaway back to being a net seller.

In the 4th quarter Berkshire Hathaway sold the last of its positions in Dunn & Bradstreet, Duke Energy, and Level 3.

03/01/2004


Leave a Reply Cancel Reply

Your email address will not be published.


Comment


Name

Email

Url


Blog Archive

2020

  • The Stock Market

2019

  • Behavioral Investing

2018

  • Trumped
  • Warren Buffett vs Wall Street
  • Globalism, 1982-2000 Bull Market

2017

  • Volatility Underlying Calm Market
  • What’s new with CB&I?
  • Passive Investing
  • Economic Cycles
  • Current Stock Market 2017 Comment

2016

  • Global Plastics Summit Highlights
  • Value Investing vs Index Investing
  • How to Play an Index Bubble
  • Successful Investors
  • Is the Market Overvalued?
  • Operating Earnings
  • Article by investment manager in Bay Hill Living
  • Building Foundation

2015

  • 3G Culture – Dream Big
  • Myopic Loss Aversion
  • CBI Nuclear Energy
  • St Joe Company
  • What’s in a Word? Plastics.
  • Are Bonds Safer Than Stocks?

2014

  • Chicago Bridge and Iron
  • CAMEX 2014
  • Global Economy October 2014
  • Fluor Corporation
  • Interesting Quotes from Daily Journal Annual Meeting
  • The Daily Journal Annual Meeting
  • Albemarle Corporation
  • Triumph Group
  • The American Energy Revolution
  • Singapore

2013

  • St Joe Company Update
  • Hedge Fund Managers
  • Triumph Group Inc.
  • Bitter Brew
  • An Antifragile Portfolio

2012

  • Leucadia National Corporation
  • This Time it is Different
  • Successful traders psychology
  • St Joe Company
  • Learning from Pain

2011

  • Long Cycles – Part II
  • Long Cycle
  • Nasty Month for Market
  • Make a Buck with Fortescue Metals Group
  • Berkshire Hathaway Look Through Earnings
  • St Joe Company Inc
  • Successful Investment Management
  • A Look Into Latin American Market
  • The Mother of all Quarters
  • 2010 Investment year results

2010

  • Fault Lines
  • US Market 2010
  • Berkshire Hathaway Third Quarter 2010
  • The Stock Market 2010
  • Berkshire Hathaway Second Quarter 2010
  • Berkshire Hathaway Performance
  • Long Term Greedy
  • Goldman Sachs
  • Berkadia and Leucadia
  • USG corporation
  • Berkshire Hathaway 2009 2010
  • Why Capitalism Works

2009

  • The Lords of Finance
  • The $44 Billion Dollar Train Set
  • Berkshire Hathaway 3rd Quarter 2009
  • Career Risk for Investment Manager
  • Berkshire Hathaway financial statements
  • Berkshire Hathaway Preferred Stock
  • Moral Hazard
  • Credit Default Swap
  • The Shadow Banking System
  • Learning Things the Hard Way
  • Our C-System
  • 2008 Investment results

2008

  • Investment Risk
  • Bear Markets
  • Generational Events
  • Orange sheets – Money is doing better
  • Inflation Not The Problem
  • Tipping Point
  • Long Term Capital Management
  • Financial Insurance
  • Western Refining Inc
  • Berkshire Hathaway Year To Date
  • Berkshire Hathaway Cash Flow
  • 2007 investment results

2007

  • Investment results 4th Quarter 2007
  • Greenspan on Inflation
  • Berkshire Hathaway Third Quarter 2007
  • Berkshire Hathaway Operating income 2007
  • Berkshire Hathaway Hedge Fund
  • Leveraged Buyouts
  • Stability Unstable
  • Weak Dollar
  • Berkshire Hathaway Chairman’s Letter
  • Steel Dynamics
  • Breakwater Resources
  • 2006 Investment year results

2006

  • New Investment Stocks
  • Equitas
  • Berkshire Hathaway Third Quarter 2006
  • Hurricane Synergy
  • Berkshire Hathaway Second Quarter 2006
  • Fat Pitch
  • Perfectly Obvious
  • Berkshire Hathaway Growth Rate
  • Berkshire Hathaway First Quarter 2006
  • Berkshire Hathaway Annual Report 2006
  • Inflation Is
  • 2005 Investment year results

2005

  • Exogenous Events
  • The Easy Money
  • Look-Through Earnings
  • High-Risk Mortgages
  • Unintended Consequences
  • Rydex Ursa Fund
  • Warren Buffett Premium
  • Private Equity
  • Latticework Mental Models
  • Buffett’s Lackluster Performance
  • 2004 Investment year results
  • Professor Smith’s Second Bubble

2004

  • Hedging Currency Disaster
  • Risk Assessment
  • Too Many Bears
  • The Chinese Century?
  • Patterned Irrationality
  • Timber
  • Costco’s Cash
  • Physics Envy by Charlie Munger
  • Asset Allocation Berkshire Hathaway
  • The Balance of Payments
  • 2003 Investment year results

2003

  • Hedge Funds
  • The trade deficit is not debt
  • Secular Bear Market
  • Which Index Funds?
  • A Different Drummer
  • Costco’s Float
  • The Power of Float
  • Berkshire Hathaway Annual Meeting 2003
  • Psychology of Human Misjudgment
  • Sitting on the Sidelines
  • Berkshire Hathaway intrinsic value
  • 2002 Investment year results

2002

  • Insurance company Moats
  • Bond Bubble
  • Berkshire Hathaway Cash Flow 2002
  • Behavioral Economics
  • The Bear Market 2002
  • Greenspan Put
  • Second Quarter Cash Flow at Berkshire Hathaway
  • Berkshire Hathaway Annual Meeting 2002
  • Red Wire – Green Wire
  • Stupid FED Tricks
  • The Bottom Line
  • 2001 Investment year results

2001

  • Don’t Fight the FED
  • Buy and Hold? – It all Depends
  • Ben Laden and Berkshire Hathaway
  • The Dinosaurs Dance
  • Costco Moat
  • Bubble Watching
  • Sit on your Ass investing
  • Berkshire Hathaway Annual Meeting 2001
  • Carnival Cruise Lines
  • 450000 Square Ft Furniture Store
  • Lunch Money Indicators – Annual report
  • Other People’s Money

2000

  • Bear Tracks
  • Build It and Money Will Come
  • Efficient Stock Market
  • Style Drift
  • Lunch Money Indicators – Options
  • Identifying Problems
  • Small Retail Stocks
  • Charlie Munger comments
  • Big Al and the Bubble Machine
  • Berkshire Hathaway Cheap
  • Index Funds
  • 16 rules for investment success
Make an appointment or contact us by phone: +1 (689) 246 49 49
© 1999 - 2022 Losch Management Company
Support by Global AGM