Volatility Underlying Calm Market
Portfolio manager’s Third Quarter 2017 Letter
Volatility Underlying a Calm Market
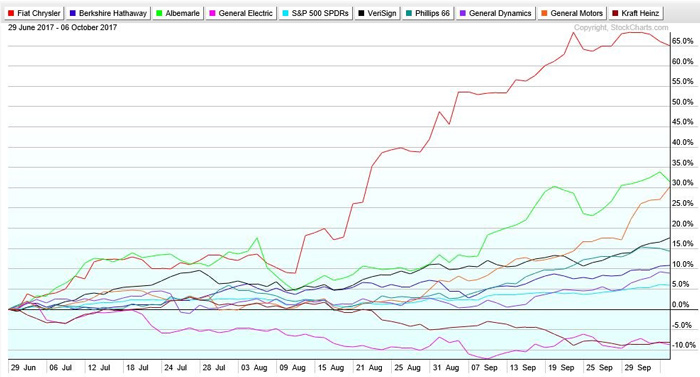
The story of the market in the third quarter is told nicely in the two charts below. On the surface it was a boring tale of nothing much going on, just a nice, slow bull market. The indexes would be up a few tenths of a percent one day then down a few the next. Market wide measures of volatility suggest record low rates of price movements. But when you take the time to look at individual stocks, there emerges a wholly different picture.
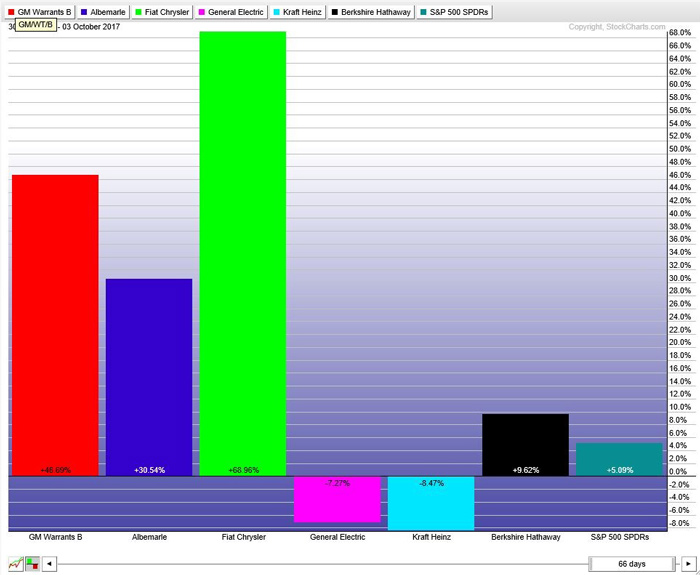
For the quarter, Fiat Chrysler soared 69% and General Motors Warrants jumped 46%. These companies, long considered dogs by conventional wisdom, are reporting strong earnings in the face of single digit PE ratios.
They belong to a large class of mid-cap and small cap stocks left behind as passive index investing caused massive capital flows into the largest US company stocks. Because both Companies have strong current earnings and single digit PE ratios, their performance this year offers hope that, perhaps, value investing is not dead.
By comparison, in the chart below, the S&P 500 index shows a very boring, almost straight-line gain of 5.1% in the third quarter, with daily changes in the S&P 500 rarely emerging from single digits. This pattern cannot go on forever, let’s try to enjoy it while we have a chance.
General Electric and Kraft Heinz represent the other end of the spectrum – large-cap stocks that have been pushed to P/E ratios that cannot be justified based on current earnings and growth prospects.
General Electric is a stock that we have never owned, but which still has a number of attractive businesses. The company’s 7% decline in third quarter does tend to draw attention. While still probably overpriced, it is a lot cheaper than a year ago.
The company’s 3rd quarter results extend a 17-year trend which has seen the company fall from the highest capitalization in the world, at over $650 Billion in 2000, to about one-third of that today. With a leadership change at hand and many divestitures of under-performing segments on the table, GE presents a situation worth following.
Albemarle rose 30% in the quarter. Albemarle’s performance is mostly the result of their strong position in Lithium production, the core of the lithium-ion battery business. At the beginning of 2017, Albemarle produced about 35% of the world’s total lithium. Currently, lithium-ion batteries power most of the world’s smart phones, but the battery business is likely to increase rapidly if the production of Electric Vehicles starts to increase rapidly, according to many recent predictions.
Today, electric vehicles are a small portion of the market for batteries, but the picture for lithium has changed rapidly this year. For example, China announced a ban on the production of internal combustion engines by 2030, GM announced the introduction 20 models of electric vehicle by 2023, and reported sales of 6700 Bolt electric cars in the third quarter, achieving a 76% increase over the rate for the first two quarters.
2016-2017 Results
Our investment results for the last two years are a story in two parts. In 2016, the outperformance was mostly the result of a strong returns by Berkshire Hathaway, with a little help from a few smaller companies like Albemarle. In 2017, our performance has changed in a rather interesting and potentially encouraging manner. Recently, some of our long-dead traditional value stocks came back to life (see some of the individual stocks shown on the charts in this section).
Middle Class Growth 2015-2030
The most popular measure of international air traffic, revenue passenger kilometers flown, grew 7.9% in the first half of the year. This is the strongest rate of growth in 12 years. Air cargo grew by 10.4 in the first half or nearly triple the average rate for the past five years.
Transportation is a fairly reliable leading indicator and thus suggesting strong growth in world. If corporate earnings respond to this growth as they have in the past, current stock valuations may not be as stretched as they currently appear.
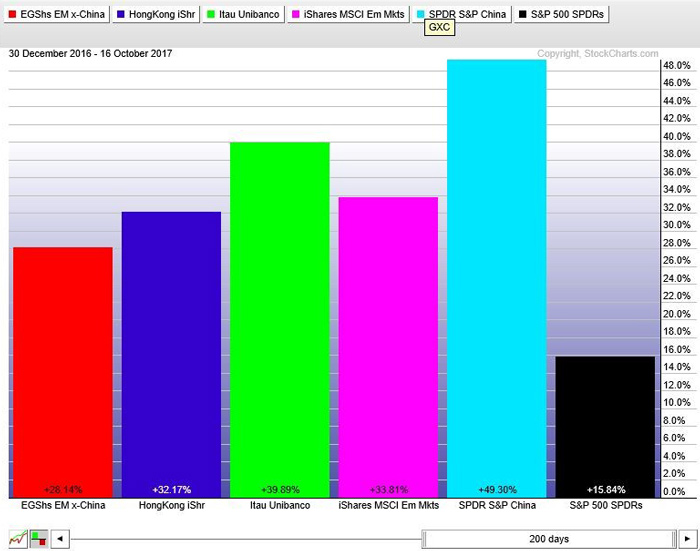
Year to date, international stocks have been strong relative to the S&P 500. The accompanying chart shows some examples from our portfolios. In the first three quarters of 2017, the S&P China ETF was up 28%. Hong Kong ETF was up 32%. Itau (the best large bank in Brazil was up 40%).
Emerging markets iShares were up 34%, and China ETF up 49%, while the S&P 500 was up 16%. These events are encouraging because they indicate that the economy in the rest of the world is finally catching up to the recovery in this country.
They also indicate that much of the growth in the next few years will come from companies with a strong international presence. Unlike the past, the market cap of the S&P 500 today represents only about 30% of the total global market cap. If the estimates quoted below are correct that share of global market cap could be a good deal smaller unless the companies in that index expand their international presence very aggressively. Any pretense to world scale will depend on doing this.
Brookings Institution’s Estimates
A study by Homi Kharas at the Brookings Institute estimates that the already burgeoning middle-class population in Asia will grow an additional 153%, from 1.4 billion to 3.5 billion (yes, that’s billion with a “b”) by 2030.
“In developed countries, middle-class consumption is about 44 percent of the global total, but averaging around $19,000 per person per year. Growth is essentially flat, at between 0.5 to 1 percent per year. In developing countries, consumption is growing far more rapidly at rates of around 6 to 10 percent per year, but from a much lower base of only $8,500 per person per year”.
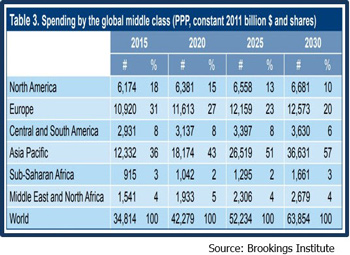
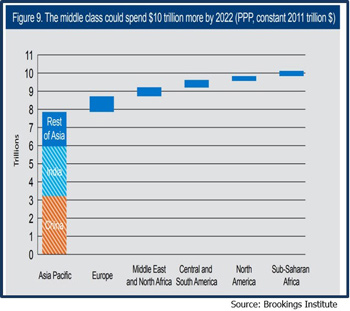
“The implications are stark. By 2022, the middle class could be consuming about $10 trillion more than in 2016; $8 trillion of this incremental spending will be in Asia … By 2030, global middle-class consumption could be $29 trillion more than in 2015 (Table 3). Only $1 trillion of that will come from more spending in advanced economies”.
“Today’s lower middle-income countries, including India, Indonesia, and Vietnam, will have middle-class markets that are $15 trillion bigger than today. Most of the remaining increase will be in today’s upper middle-income countries, like China and Brazil. By 2030, Asia will account for well over half the total middle-class consumption market. Even though there will be substantial growth in the African middle class, the base is so small that the expansion in market size is limited. Still, sub-Saharan Africa could have a middle-class market in 2030 of about the same size as the Middle East today.
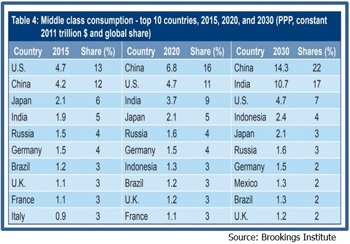
To see this in more detail, Table 4 shows the numbers in the largest middle-class economies. The United States had the largest middle-class market in the world ($4.7 trillion) but was likely overtaken by China (albeit in PPP terms) in 2016. The Indian middle-class market is growing fast and probably overtook Japan to move into third spot in 2016. By 2022, India could also overtake the U.S. and become the second-largest middle-class market in the world”.
Much of original that 1.4 billion is the result of the expansion of international trade in 1980’s and 1990’s. In contrast, middle income growth in North America is estimated at 6%, growth in Europe by 1%. In Central and South America, the category is expected to expand 18%, Sub-Saharan Africa by 86%, and Middle East and North Africa, by 48%.
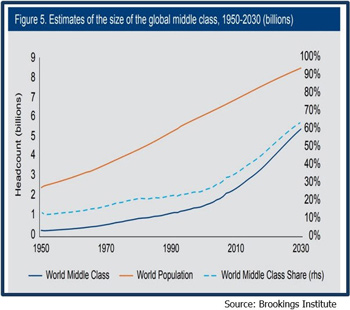
Figure 5 shows the growth of the world population since 1950. The bottom dark blue line shows the growth of the middle class and clearly indicates the acceleration that began with expansion of global trade in the 1980’s. It also shows that the rate of increase will be sharper for the next 15 years.
Granted these figures are estimates and must be taken accordingly, nor do they give any give any direct estimate of growth in consumer spending in these regions, but they certainly are “this time it is different” figures when it relates global income growth. Whether they will be a “this time is different” event as it relates to corporate earnings growth and market gains, remains to be seen.
We have never before experienced middle class growth at anything close to this level, except perhaps in the 1980’s and 1990’s when the expansion of world trade lifted 2 billion out of poverty. What this growth irrefutably demonstrates, if the actual figures end anywhere close to the estimates in this report, is the power of free markets to benefit the great mass of the world’s population.
The expansion of world trade made possible with advances technology developed in the last half of the twentieth century has encouraged the spread of the free market philosophy around the world. The result has done infinitely more to relieve poverty than all the anti-poverty programs created by politicians since Roman times, and it did not cost taxpayers a dime.
For investors, the implications of this middle-class growth outside the US will be critical. Indexing by using the S&P 500 index will produce sub par results. Many individual US companies that have strong international business will do well to the extent that they can maintain world class scale, and that will certainly depend on their ability to rapidly expand their business in Asian markets.
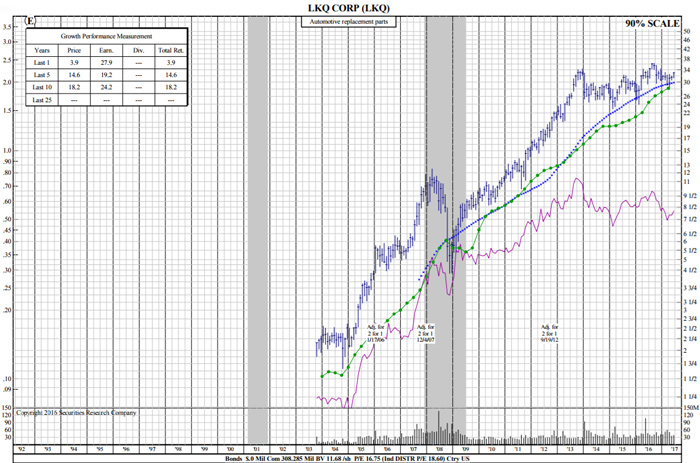
LKQ Corporation
LKQ is a leading distributor and marketer of specialty aftermarket equipment and accessories for automobiles and trucks in North America, the largest distributor of mechanical and collision alternative parts in the United Kingdom, and the largest distributor of mechanical parts in the Netherlands. With LKQ’s acquisition of Pittsburgh Glass Works LLC (“PGW”), LKQ has also become a leader in the design, production and supply of automotive glass to car and truck manufactures.

LKQ was initially formed in 1998 through the combination of wholesale recycled products businesses (aka, junk yards) located in Florida, Michigan, Ohio and Wisconsin. From these humble beginnings, the company has achieved remarkable growth, both through internal development and over 220 acquisitions of aftermarket, recycled, refurbished, and remanufactured product suppliers and manufacturers; self-service retail businesses; and specialty vehicle aftermarket equipment and accessories suppliers. Their most significant acquisitions include:
- 2007 acquisition of Keystone Automotive Industries, Inc., a leading domestic distributor of aftermarket products, including collision replacement products, paint products, refurbished steel bumpers, bumper covers and alloy wheels.
- 2011 acquisition of Euro Car Parts Holdings Limited (“ECP”), a vehicle mechanical aftermarket parts distribution company operating in the United Kingdom.
- 2013 acquisition of Sator Beheer B.V. (“Sator”), a vehicle mechanical aftermarket parts distribution company based in the Netherlands, with operations in the Netherlands, Belgium and Northern France.
- 2014 acquisition of Keystone Specialty, which expanded our product offering and increased our addressable market to include specialty vehicle aftermarket equipment and accessories.
- 2016 acquisition of Rhiag-Inter Auto Parts Italia (“Rhiag”), a pan-European business-to-business distributor of aftermarket spare parts for passenger cars and commercial vehicles, with operations in Italy, Czech Republic, Switzerland, Hungary, Romania, Ukraine, Bulgaria, Slovakia, Poland and Spain, serving more than 57,000 professional clients.
- 2016 acquisition of 26.5% of Mekonomen, the leading independent car parts and service chain in the Nordic region of Europe.
Following these acquisitions, LKQ works to optimize the operations of the new division, either through consolidation where synergies exist, or expansion for growth opportunities. In the case of Rhiag, LKQ has added more than 40 new branch locations in 2017. Given the advanced age of the car fleets in the Eastern European countries where Rhiag operates, LKQ management anticipates adding 10-12 new branches per quarter for a very long time to come.
Risks
One potential headwind that LKQ faces is that the very phenomenon of consolidation, which has benefitted LKQ, is also taking place in their customer base. As repair shops are being acquired by larger umbrella organizations, their greater buying power may be showing up in lower LKQ profit margins. However, larger customers placing larger orders need a supplier who can deliver larger fulfillment. In this regard, LKQ is unmatched, being 20x larger than its next competitor.
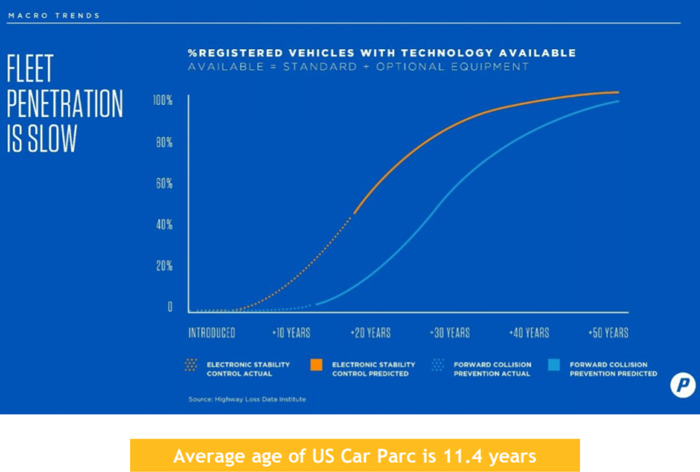
Other business risk questions for LKQ relate to self-driving cars and collision avoidance systems reducing auto and truck accidents and the demand for LKQ’s parts. The issues surrounding the introduction of self-driving cars in a mixed usage scenario are many and deep, and could even result in increased revenues for LKQ. Full adoption of autonomous vehicles, in any case, would appear to be many years away. Even in the nearer term, collision avoidance systems, such as emergency braking and forward- collision warnings are entering the automotive fleet slowly.
Source: LKQ
There are 260 million cars in the US, with about a 5% turnover rate. About 13-17 million new cars enter the fleet each year, and about an equivalent number of older cars are scrapped. CCC Information Services estimates a 10.3% reduction in collision losses by 2030, and 24.3% reduction by 2050. Due to the potentially high cost of cars equipped with advanced new technology, it is conceivable that older cars may be maintained even longer, particularly in less developed countries.
In addition, due to significantly higher cost of high tech replacement parts for the newer cars (in some cases by a factor of 4x), LKQ revenues may benefit even while selling fewer parts.