Long Cycle
Portfolio manager’s Letter Oct – Nov 2011
I have written before about long cycle (secular) bear and bull markets in stock prices. This long cycle is not caused by celestial phenomenon, Kondratieff Waves, or other mysteries, but are the result of cumulative impact of emotion on investor behavior, the decay of investor memory, and the power of mass hysteria. The “Long cycle” chart below gives a clear picture of this long cycle since the beginning of the twentieth century. The dark color represent long cycle (secular) Bear Markets, the light color show long cycle (secular) bull markets. This chart of the Dow Jones average shows that for 56 of the last 110 years the market as a whole has shown little or no long term gain.
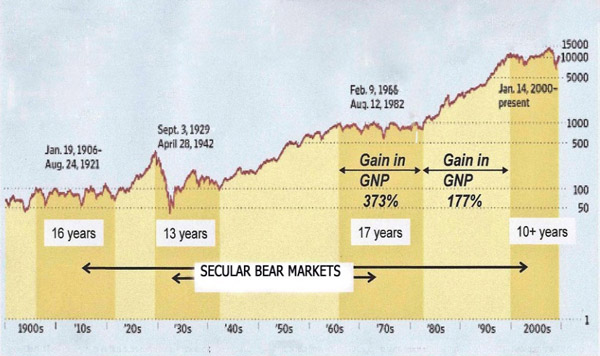
As a general rule each of these long cycle bear markets contained several short term (cyclical) bear and bull markets with at least one correction of 50%. Although the bear markets appear fairly benign on this chart, they are anything but. As anyone knows who has had skin in the game for the last eleven years, the market has been a roller coaster that has provided the average investor with many great opportunities for wealth destruction.
In the early part of the economic cycle central banks are expanding credit and printing money. This transmits to the market place a message that the demand for products is increasing, and sets in place the expansionary business cycle. The possibility exists that to some extent the central banks by their intervention are transmitting false information to the market place.
Corporate Profits Long Cycle
The table below lists corporate profits at the beginning and the end of the market cycles identified in the chart above. The table begins with 1929 because that is the first year for which the Bureau of Economic Analysis gives us data on corporate profits.
Corporate Profits 1929 – 2011
|
Market Phase |
Year |
Corporate Profits Before Tax (Mil) |
Average Annual Gain For Period |
Average Annual Gain 1929 – 2011 |
|
Bear |
1929 | $10.4 | ||
| 1942 | $21.7 | 6.32% | ||
|
Bull |
1942 | $21.7 | ||
| 1966 | $82.2 | 5.17% | 6.33% | |
|
Bear |
1966 | $82.2 | ||
| 1982 | $166.0 | 4.49% | ||
|
Bull |
1982 | $166.0 | ||
| 2000 | $626.8 | 7.66% | ||
|
Bear |
2000 | $626.8 | ||
| 2011 | $1600.0 (Est) | 8.89% |
Obviously, the most interesting thing about the table is the fact that there is no apparent relationship between the market cycles identified above and corporate profits, in all but one case (1966-1982), corporate profits where better during the bear markets that they were during the bull markets. Since Investors expect stock prices to follow the path of the per share earnings of the underlying stock, how do we explain these long periods where Mr. Market ignores positive earnings?
We are left to conclude that the history of the stock market is one of long periods of expanding PE multiples (long cycle (secular) bull markets), followed by a long period of contracting PE multiples (long cycle secular bear market). While this pattern does nothing to support the notion of efficient markets, it does find considerable support in the work of the behavioral economists. In any event it is probably time to take whole body of market analysis away from the economists and hand it over to the psychiatrists.
Kahneman about Long Cycle
Daniel Kahneman in his outstanding new book “Thinking Fast and Slow” Presents a very interesting description of the human thought process. Whenever making a decision we tend to rely heavily on our “System 1” behavior, this is the hard-wired tendency to make snap decisions without recourse to the hard work of rational thought, this is particularly true when the decision is difficult, or a result is impossible to forcast, and even if slow careful thought would give you a better basis for assessing probable consequences.
Kahneman calls the human brain “a machine for jumping to conclusions”. The problem is that intuitive thinking, except with few significant exceptions, tends to be wrong. The thing that makes “System 1” popular is that tends to present quick easy answers to difficult questions, and makes us sound smart even though our answer may not be correct. “System 1” is particularly useful when the question is difficult (is beyond intellectual capacity and experience) or whereas in the case predicting the future of the economy or the market it is impossible.
What makes “System 1” relevant to this discussion is what Kahneman calls WYSIATI “what you see is all there is” “System 1” is very good at constructing an answer from whatever information is available in your brain and then as he says “jumping to a conclusion”. Since our “System 1” is focusing on the information that is available in the brain it is by definition focusing on the past. And so, in the market whatever trend is in place tends to stay in place. In a bear market our “System 1” is powered by negative outcomes. In a bull market the brain is ruled by positive data from the recent past, so “System 1” becomes a momentum machine.
The longer the trend continues the more data that is available in “System 1” to support the current trend. We have only to look at our recent past to understand the power of “System 1” to overwhelm rational thought.
Minsky about Long Cycle
The 1970’s Economist Hyman Minsky said that Capitalism is inherently unstable, by which he meant that during periods of prosperity, when banks and other financial institutions are earning money and their earnings are increasing steadily year after year, competitive pressures from the market place will tend to push these institutions into investments with higher and higher risk.
Investors start the bull cycle with a very low tolerance for risk, having just survived 15 to 17 year bear market. With their “System 1” full disasters it is easy to conclude that today’s problems will all end badly. By the end of the up cycle a couple of decades later, (after years of steadily risings prices and low levels of loan default) investors have lost their memory of, and the ability to understand, risk. Their “System 1” is full of only positive outcomes. Time numbs the pain of the past as the investor discovers that the guy across the street is making more money than he is, so his risk tolerance expands.
The irrationality generated by our recent cycle created two great bubbles, the internet bubble and the housing bubble. These bubbles have generated a level of collective insanity unmatched by anything we have experienced in the past, and were not in any sense limited to the United States, but spread like a virus throughout the developed and the developing world. Nor was the insanity limited to financial institutions, but spread across the populace of most of the countries involved, as citizens of all stripes sought instant gratification bought with someone else’s money.
Michael Lewis’ excellent new book “Boomerang” details fascinating tales of this financial mania as it traveled from an exploitative Wall Street to naive and unsophisticated Banks in Ireland, Iceland, and Germany. He details how the financially corrupt were aided and abetted by morally bankrupt political systems in places like Greece and U.S. (His best example in the U.S. California). Thus we see the folly generated by our “System 1”.
So we have a bull long cycle where PE ratios expand till they grow bubbles, and a bear long cycle where PEs shrink down to single digits. It make it seem as thought markets are not ruled by corporate earnings so much as they are measuring the investors’ current psychosis.
Implications of Long Cycle
What does this mean for investors? It is important to recognize what long cycle (secular) you are in, and what part of that long cycle. While the long cycle have little day to day impact on stock prices it is important to understand that interpretation of PE ratios will be continuously changing and that, in a long term trend, PE ratios will either be contracting (1966 – 1982; 2000 – present) or expanding (1942 – 1966; 1982 – 2000) irrespective of the general long term up trend in corporate earnings.
It also obvious from the chart above that the best time to buy stock is toward end bear market cycle. This may have some interesting implications for investments made in the next two or three years, and we will return to the subject in the future.
Even for those of us who accept that these cycles are real we have to wonder how long they will continue. For the answer to this question we clearly do not need to consult with stock market analysts, but need to study the nature of human behavior and mass psychology. Probably we can expect these cycles to disappear about the time there is a genetic mutation that eliminates system 1 from the human gene pool.