Secular Bear Market
Portfolio manager’s Letter October 2003
194 month secular bear market

February 9, 1966 To August 12, 1982
It is generally accepted that The Great Bubble of the 1990’s carried the stock market to the point of extreme overvaluation. It is also true that many stocks remain over-valued today, and that the distortions introduced by the bubble will take many years to correct. This does not mean however, that the market will more steadily down till it reaches fair value or less.
In 1966 the market entered a secular correction phase that may or may not prove similar to today’s market. The market did not move straight down to its eventual low and recover steadily from that low. From 1966 to 1982 the Dow was stuck in a trading range between 577 and 1000. This may not sound so bad but for those of us that were participating, it was a series of dull, slow, bull markets that always petered out at around one thousand on the Dow. These bull markets were separated by grinding gut-wrenching bear markets.
Overall, the market experienced four separate cyclical bull markets during the 1966 – 1982 Long term bear. Each of these provided the chance to make money by following the short term bull market.
Table 1966-1982 Cyclical Bull Markets
| Begin Date | Dow | End Date | Dow | Gain % | Length (Months) |
| 10/7/1966 | 744.32 | 12/3/1968 | 985.21 | 32.4% | 26 |
| 5/26/1970 | 631.16 | 1/11/1973 | 1051.70 | 66.6% | 32 |
| 12/6/1974 | 577.60 | 9/21/1976 | 1014.79 | 75.7% | 21 |
| 2/28/1978 | 742.12 | 4/27/1981 | 1024.05 | 38.0% | 38 |
During each of the four cyclical, bull markets listed above, the Dow Jones Industrial Average returned to the area of the prior secular bull market peak of 995.15, recorded on February 9, 1966. It is interesting that during this 194 month secular bear market there was 117 months were the market was going up. While buy and hold is a legitimate long term investment philosophy, it can be a difficult strategy during the kind of market that we experienced in the seventies.
One thing that is certain, markets change, and it is unlikely that our current secular trend will be an exact repeat of the experience of the seventies. But human behavior does not change that much, so it would not come as a surprise to me to see some of the patterns of the seventies reappear, and a series of cyclical bear markets and cyclical bull markets does appear likely within the secular bear market mega trend that started in early 2000. Long-term investors are likely to experience a level of frustration that will chase many of them out the stock market for a long time.
The Current Market
Currently the Wilshire Index is up 36% from the low in October of last year, so this already qualifies as a cyclical Bull, the question is, does it have anything left. The prior secular bull market peak for the Standard and Poor’s 500 Index stands at 1527.46 on March 24, 2000. There have not been any challenges to this peak price level since Year 2000. Nor is it likely that the current rally will carry us anywhere near that old high, however, a look at the table above might indicate that this particular cyclical bull might have a while to run.
My memory of the seventies was that rallies always began with everyone sitting on their hands, listening mainly to the wall of worry. After a while (usually about a year) the wall of worry would begin to disappear, and people became more comfortable with their existing positions. But there was still reluctance to commit new money. The rally would continue until investors noticed they were missing a lot potential gains. Toward the end, the flow of money into that market would become a torrent as investor’s panic, having switched emotionally from fear of loss of capital to fear of missing a profit.
By now the economy would be into a strong recovery and the wall of worry would be long gone. After sitting on cash for two years and watching the market go up, all the cash on sidelines would eventually get committed. Invariably at that point that you were finally comfortable that the Secular bull had returned the market would roll over and return to the toilet.
In the short term the market is a voting machine, so psychology is a lot more important than the efficient refection fundamental valuations. Markets are about emotion and human behavior. To make a market bottom you have to get everyone thoroughly bearish, and for the cyclical bear to return you have get everyone a lot more bullish than they are at present. There are still too many things to worry about. The market selling last week was accompanied by too much speculative shorting.
The Election Cycle
There is of course also a fundamental argument for further market strength, this is the third year of an election cycle, and politicians being politicians they have done everything possible to stimulate the economy ahead of next years election, monetary stimulation, deficit financing, and now the attempts to lower the value of the dollar. The combined three front stimulation could well bring the economic pot to a strong boil next year, and provide the kind earnings gains that will produce enough euphoria to produce another good market top.
All this is just speculation of coarse, and there is no way of successfully timing the market, but now is a time to be especially conscious of value because that is the only way of remaining invested and limit risk at the same time. It is a time buy with a margin of safety, and to establish a price at which your purchase has lost its margin of safety because of appreciation, and should be sold.
Duke Energy
For an example of a pure old fashioned value trade let us look at Berkshire Hathaway’s recent purchase of Duke Energy (DUK on the NYSE). According to recent 13f filings, in December Berkshire Hathaway reported no position in Duke Energy; on March 31 they owned 4.8 million shares, a position that had been reduced by June 30 to 1.4 million shares. While this type of trade might seem out of character for Berkshire Hathaway, (holding period somewhat short of forever) a look at the chart provides some interesting insight.
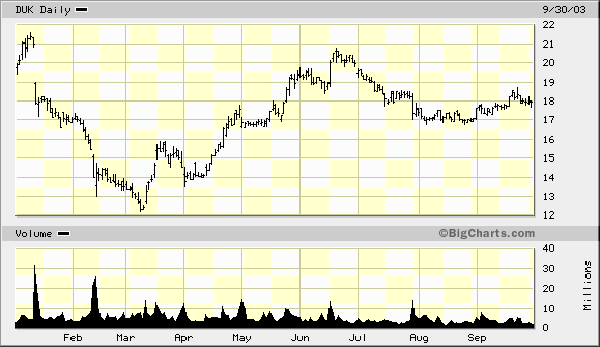
From a high of $21 in January DUK fell briefly below $13 in early March and then recovered to trade above $20 in late June. While we will never know for sure Berkshire entry or exit points, it is possible set up a theoretical trade in hope of gaining some insight into classic value investing.
Buffett clearly does not “time” the market, so how do you explain this quick turn in DUK? “We Like to Place the emphasis on value” Buffett says, and in truth this is the critical difference between market timing and classical value investing.
So let’s assume that someone at Berkshire Hathaway (most likely Lou Simpson based on the size of the position) was watching as DUK tanked in January and February and when stock arrived a price that included the requisite margin of safety they put in a 4.8 million share position. In the three days that the stock trade below 13 the volume was about 18 million shares, so it is conceivable that Berkshires bought below that level, and logic tells us that their buy price was probably not much higher than this or they would have been able to put in a bigger position.
At 4.8 million shares the purchase would only have amounted to about $62 million a position so small that leads me to believe the price recovered to above Berkshire Hathaway’s target price before they could put in a decent position. Then as the stock recovered to 20 in June it was felt that it was approaching full value and was sold. Notice the difference between classical value investing and market> timing. The “Emphasis is on value” You buy at a price that includes a margin of safety and sell when stock approaches fair value.
Sometimes classical value investing can look like market> timing but the distinction is very important because instead of trying to guess what the market is going to do, you can ignore the market and focus only on the price of the individual stock. It is always important when establishing a position to make sure that your purchase prices includes a margin of safety. Perhaps just as important, given the secular nature of today’s market is to have a clear idea in your mind of a price at which you feel the stock will be fully valued, and therefore require an exit.