• Home
  • About
  • Team
  • Contacts
  • Blog

Berkshire Hathaway Operating income 2007

  1. Home
  2. Blog
  3. Berkshire Hathaway O ...

Portfolio manager’s Letter September 2007

Berkshire Hathaway operating income three tables

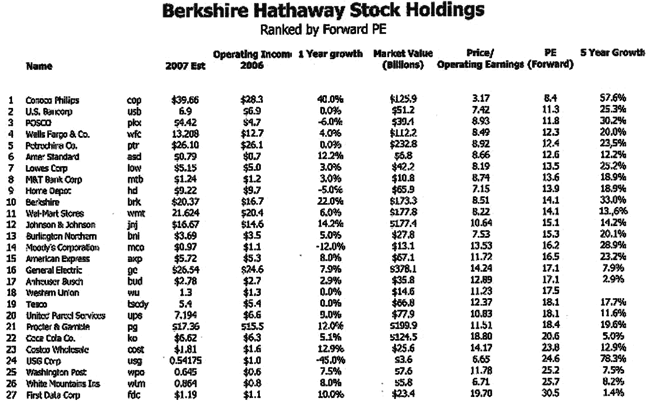
I presented here are three tables comparing the value of Berkshire Hathaway with some of Warren Buffett’s recent purchases. Also included for the sake of comparisons are some of the stocks of Berkshire Hathaway’s long term holdings. All three tables show Berkshire Hathaway operating income, the ratio of current operating earnings divided by price as of July 1, 2007, the forward price earnings ratio on July 1, 2007, and the company’s growth rate for the last 5 years.

For Table One the stocks have been sorted by the forward PE ratio, with the cheapest stock at the top of the list. On this basis Conoco Phillips is the cheapest with a PE of 8.4. Burlington Northern is about the middle of the list with a PE of a little over 15, and generally the stocks as a group appear reasonably priced if not cheap with about half to the list showing a PE of less than 15.

Berkshire Hathaway PE

For Table Two the stocks are sorted on the basis of Berkshire Hathaway operating income divided by the per share price. Berkshire Hathaway operating income is sometimes a better indication of value, than PE, because it is not as affected by one-time items and other games. By this measure the recent purchases appear even cheaper, with 16 out of the 27 stocks at or below Warren Buffett’s preferred ratio of 10 times operating earnings or less. Looking at this list of Berkshire Hathaway Operating income it is not hard to understand why Warren Buffett has been able to spend $15 billion in new purchases since 2005.

Berkshire Hathaway operating income

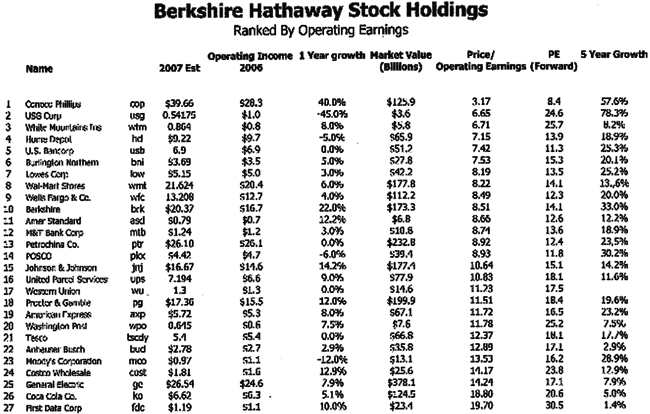
Table Three sorts the stocks according to annual earnings growth for the last five years. Note that the rate shown for Berkshire Hathaway is actually for revenue growth not earnings. I used the revenue figure because in 2001 Berkshire Hathaway’s earnings were very low because of losses at the World Trade Center, so any comparison starting with that year gives an unrealistic growth rate for earnings. Nevertheless, Berkshire Hathaway places number three on this list in terms of earnings growth.

Berkshire Hathaway annual earnings growth

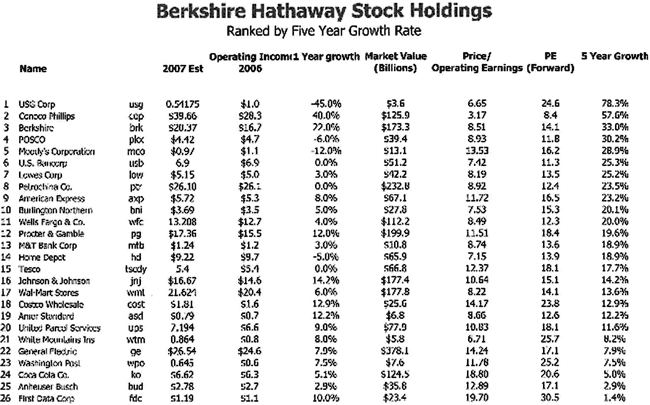
The only companies showing more rapid earnings growth are USG with 78.3%, and Conoco Phillips at 57.0% two cyclical companies ridding the tail end of their growth cycle. Neither of which likely to maintain this growth into the near future. This leaves us with the impression that Berkshire Hathaway will be able to sustain its growth at a higher rate the than the companies Warren Buffett has been buying. As of the date that this table was prepared Berkshire Hathaway was selling at 8.5 times operating earnings, and cheap as this appears it includes nothing for the operating earnings of Berkshire Hathaway’s investees.

The after tax earnings of Berkshire Hathaway’s investees haves been increasing rapidly in the last couple of years because of Warren Buffett’s equity purchases and last year increased 33% to $1,222 per share.

09/01/2007


Leave a Reply Cancel Reply

Your email address will not be published.


Comment


Name

Email

Url


Blog Archive

2020

  • The Stock Market

2019

  • Behavioral Investing

2018

  • Trumped
  • Warren Buffett vs Wall Street
  • Globalism, 1982-2000 Bull Market

2017

  • Volatility Underlying Calm Market
  • What’s new with CB&I?
  • Passive Investing
  • Economic Cycles
  • Current Stock Market 2017 Comment

2016

  • Global Plastics Summit Highlights
  • Value Investing vs Index Investing
  • How to Play an Index Bubble
  • Successful Investors
  • Is the Market Overvalued?
  • Operating Earnings
  • Article by investment manager in Bay Hill Living
  • Building Foundation

2015

  • 3G Culture – Dream Big
  • Myopic Loss Aversion
  • CBI Nuclear Energy
  • St Joe Company
  • What’s in a Word? Plastics.
  • Are Bonds Safer Than Stocks?

2014

  • Chicago Bridge and Iron
  • CAMEX 2014
  • Global Economy October 2014
  • Fluor Corporation
  • Interesting Quotes from Daily Journal Annual Meeting
  • The Daily Journal Annual Meeting
  • Albemarle Corporation
  • Triumph Group
  • The American Energy Revolution
  • Singapore

2013

  • St Joe Company Update
  • Hedge Fund Managers
  • Triumph Group Inc.
  • Bitter Brew
  • An Antifragile Portfolio

2012

  • Leucadia National Corporation
  • This Time it is Different
  • Successful traders psychology
  • St Joe Company
  • Learning from Pain

2011

  • Long Cycles – Part II
  • Long Cycle
  • Nasty Month for Market
  • Make a Buck with Fortescue Metals Group
  • Berkshire Hathaway Look Through Earnings
  • St Joe Company Inc
  • Successful Investment Management
  • A Look Into Latin American Market
  • The Mother of all Quarters
  • 2010 Investment year results

2010

  • Fault Lines
  • US Market 2010
  • Berkshire Hathaway Third Quarter 2010
  • The Stock Market 2010
  • Berkshire Hathaway Second Quarter 2010
  • Berkshire Hathaway Performance
  • Long Term Greedy
  • Goldman Sachs
  • Berkadia and Leucadia
  • USG corporation
  • Berkshire Hathaway 2009 2010
  • Why Capitalism Works

2009

  • The Lords of Finance
  • The $44 Billion Dollar Train Set
  • Berkshire Hathaway 3rd Quarter 2009
  • Career Risk for Investment Manager
  • Berkshire Hathaway financial statements
  • Berkshire Hathaway Preferred Stock
  • Moral Hazard
  • Credit Default Swap
  • The Shadow Banking System
  • Learning Things the Hard Way
  • Our C-System
  • 2008 Investment results

2008

  • Investment Risk
  • Bear Markets
  • Generational Events
  • Orange sheets – Money is doing better
  • Inflation Not The Problem
  • Tipping Point
  • Long Term Capital Management
  • Financial Insurance
  • Western Refining Inc
  • Berkshire Hathaway Year To Date
  • Berkshire Hathaway Cash Flow
  • 2007 investment results

2007

  • Investment results 4th Quarter 2007
  • Greenspan on Inflation
  • Berkshire Hathaway Third Quarter 2007
  • Berkshire Hathaway Operating income 2007
  • Berkshire Hathaway Hedge Fund
  • Leveraged Buyouts
  • Stability Unstable
  • Weak Dollar
  • Berkshire Hathaway Chairman’s Letter
  • Steel Dynamics
  • Breakwater Resources
  • 2006 Investment year results

2006

  • New Investment Stocks
  • Equitas
  • Berkshire Hathaway Third Quarter 2006
  • Hurricane Synergy
  • Berkshire Hathaway Second Quarter 2006
  • Fat Pitch
  • Perfectly Obvious
  • Berkshire Hathaway Growth Rate
  • Berkshire Hathaway First Quarter 2006
  • Berkshire Hathaway Annual Report 2006
  • Inflation Is
  • 2005 Investment year results

2005

  • Exogenous Events
  • The Easy Money
  • Look-Through Earnings
  • High-Risk Mortgages
  • Unintended Consequences
  • Rydex Ursa Fund
  • Warren Buffett Premium
  • Private Equity
  • Latticework Mental Models
  • Buffett’s Lackluster Performance
  • 2004 Investment year results
  • Professor Smith’s Second Bubble

2004

  • Hedging Currency Disaster
  • Risk Assessment
  • Too Many Bears
  • The Chinese Century?
  • Patterned Irrationality
  • Timber
  • Costco’s Cash
  • Physics Envy by Charlie Munger
  • Asset Allocation Berkshire Hathaway
  • The Balance of Payments
  • 2003 Investment year results

2003

  • Hedge Funds
  • The trade deficit is not debt
  • Secular Bear Market
  • Which Index Funds?
  • A Different Drummer
  • Costco’s Float
  • The Power of Float
  • Berkshire Hathaway Annual Meeting 2003
  • Psychology of Human Misjudgment
  • Sitting on the Sidelines
  • Berkshire Hathaway intrinsic value
  • 2002 Investment year results

2002

  • Insurance company Moats
  • Bond Bubble
  • Berkshire Hathaway Cash Flow 2002
  • Behavioral Economics
  • The Bear Market 2002
  • Greenspan Put
  • Second Quarter Cash Flow at Berkshire Hathaway
  • Berkshire Hathaway Annual Meeting 2002
  • Red Wire – Green Wire
  • Stupid FED Tricks
  • The Bottom Line
  • 2001 Investment year results

2001

  • Don’t Fight the FED
  • Buy and Hold? – It all Depends
  • Ben Laden and Berkshire Hathaway
  • The Dinosaurs Dance
  • Costco Moat
  • Bubble Watching
  • Sit on your Ass investing
  • Berkshire Hathaway Annual Meeting 2001
  • Carnival Cruise Lines
  • 450000 Square Ft Furniture Store
  • Lunch Money Indicators – Annual report
  • Other People’s Money

2000

  • Bear Tracks
  • Build It and Money Will Come
  • Efficient Stock Market
  • Style Drift
  • Lunch Money Indicators – Options
  • Identifying Problems
  • Small Retail Stocks
  • Charlie Munger comments
  • Big Al and the Bubble Machine
  • Berkshire Hathaway Cheap
  • Index Funds
  • 16 rules for investment success
Make an appointment or contact us by phone: +1 (689) 246 49 49
© 1999 - 2022 Losch Management Company
Support by Global AGM